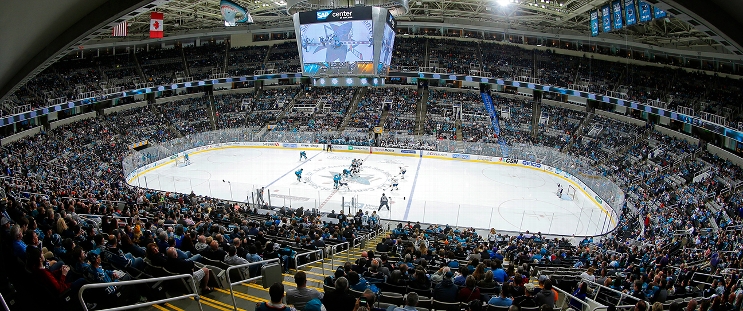
Detroit Red Wings at San Jose Sharks
· National Hockey LeagueCelebrini scores first career OT goal as Sharks top Red Wings 5-4

William Ecklund had two goals, and Luke Kunin and Tyler Toffoli also scored for San Jose. who have won two straight and are 3-1-2 in their last six games. Mackenzie Blackwood finished with 16 saves.
Dylan Larkin had a goal and had an assist, and Alex DeBrincat, Marco Kasper and Michael Rasmussen also scored for Detroit, which has lost five of six. Cam Talbot stopped 29 shots.
Detroit trailed 4-3 with 2:06 left in regulation when DeBrincat tied it on a power-lay goal.
Celebrini, the 2024 No. 1 overall draft pick, then won it in the extra period with his fourth goal of the season and first career overtime score.
Sharks: The rebuilding Sharks are 6-5 since losing nine straight to start the season. They trailed most of the game but played inspired hockey, especially late, as they rallied for the win.
SJ leads series 1-0
Scoring Summary
 |
Goal | 1st Period 7:28 | Dylan Larkin Goal (11) Backhand, assists: Simon Edvinsson (5) |
 |
Goal | 1st Period 10:28 | William Eklund Goal (3) Wrist Shot, assists: Alexander Wennberg (5), Jake Walman (10) |
 |
Goal | 1st Period 18:48 | Marco Kasper Goal (2) Wrist Shot, assists: Erik Gustafsson (3), Vladimir Tarasenko (5) |
 |
Goal | 2nd Period 5:59 | William Eklund Goal (4) Wrist Shot, assists: Mario Ferraro (3), Fabian Zetterlund (7) |
 |
Goal | 2nd Period 8:11 | Michael Rasmussen Goal (3) , assists: none |
 |
Goal | 2nd Period 19:18 | Tyler Toffoli Goal (9) Wrist Shot, assists: Alexander Wennberg (6), Ty Dellandrea (2) |
 |
Goal | 3rd Period 6:19 | Luke Kunin Goal (3) Wrist Shot, assists: Carl Grundstrom (4), Henry Thrun (6) |
 |
Goal | 3rd Period 17:54 | Alex DeBrincat Goal (8) Backhand, assists: Lucas Raymond (15), Dylan Larkin (4) |
 |
Goal | 4th Period 0:46 | Macklin Celebrini Goal (4) Wrist Shot, assists: Mikael Granlund (12), Cody Ceci (4) |
Statistics
 DET DET |
 SJ SJ |
|
|---|---|---|
| 11 | Blocked Shots | 12 |
| 13 | Hits | 22 |
| 5 | Takeaways | 7 |
| 20 | Shots | 34 |
| 2 | Power Play Goals | 1 |
| 3 | Power Play Opportunities | 4 |
| 66.7 | Power Play Percentage | 25.0 |
| 0 | Short Handed Goals | 0 |
| 0 | Shootout Goals | 0 |
| 28 | Faceoffs Won | 34 |
| 45.2 | Faceoff Win Percent | 54.8 |
| 16 | Giveaways | 18 |
| 4 | Total Penalties | 3 |
| 8 | Penalty Minutes | 6 |
Game Information
 SAP Center at San Jose
Location: San Jose, CA
Attendance: 11,180 | Capacity:

Location: San Jose, CA
Attendance: 11,180 | Capacity:
2024-25 Atlantic Division Standings
| TEAM | W | L | PTS | OTL |
|---|---|---|---|---|
 Toronto Toronto |
27 | 13 | 56 | 2 |
 Florida Florida |
24 | 15 | 50 | 2 |
 Boston Boston |
20 | 18 | 45 | 5 |
 Tampa Bay Tampa Bay |
21 | 15 | 44 | 2 |
 Ottawa Ottawa |
19 | 17 | 41 | 3 |
 Montreal Montreal |
19 | 18 | 41 | 3 |
 Detroit Detroit |
18 | 18 | 40 | 4 |
 Buffalo Buffalo |
15 | 21 | 35 | 5 |
2024-25 Pacific Division Standings
| TEAM | W | L | PTS | OTL |
|---|---|---|---|---|
 Vegas Vegas |
28 | 9 | 59 | 3 |
 Edmonton Edmonton |
25 | 12 | 53 | 3 |
 Los Angeles Los Angeles |
23 | 10 | 51 | 5 |
 Vancouver Vancouver |
18 | 12 | 45 | 9 |
 Calgary Calgary |
19 | 14 | 45 | 7 |
 Anaheim Anaheim |
17 | 18 | 39 | 5 |
 Seattle Seattle |
17 | 21 | 37 | 3 |
 San Jose San Jose |
13 | 24 | 32 | 6 |

