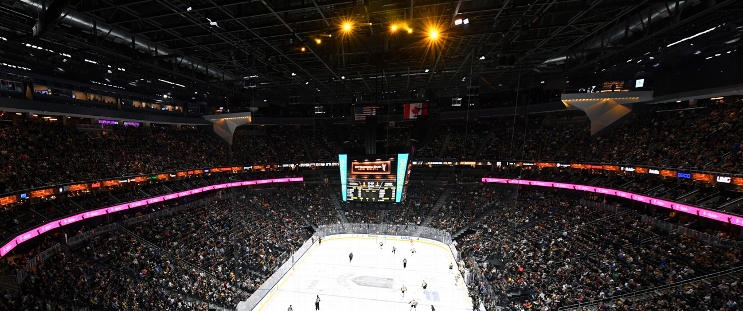
Washington Capitals at Vegas Golden Knights
· National Hockey LeagueOvechkin's hat trick and Thompson's 40 saves lead Capitals to 5-2 win over Golden Knights

Jakob Chychrun and Jakub Vrana also scored goals for the Capitals, and Dylan Strome and Aliaksei Protas each had two assists.
Brett Howden and Keegan Kolesar scored for the Golden Knights, and Ilya Samsonov stopped 20 shots.
Ovechkin now has 866 goals, 29 from surpassing The Great One as the NHL career leader. It was his 31st career hat trick and his 176th career multigoal game, behind only Gretzky's 189. Ovechkin also extended his record to 315 power-play goals.
Both goals also were his first against former Capitals goalie Samsonov.
The Golden Knights played a video tribute to Thompson, who played for the club from 2021-24, midway through the first period. He appeared emotional as the crowd roared, repeatedly tapping his heart.
Vegas' loss left coach Bruce Cassidy still one victory shy of 400.
Golden Knights: Jack Eichel extended his point streak to six games. He has two goals and 10 assists over that stretch.
WSH wins series 2-0
Scoring Summary
 |
Goal | 1st Period 5:59 | Alex Ovechkin Goal (11) Wrist Shot, assists: John Carlson (11), Dylan Strome (20) |
 |
Goal | 1st Period 12:26 | Jakob Chychrun Goal (5) Wrist Shot, assists: Dylan Strome (21) |
 |
Goal | 1st Period 19:52 | Brett Howden Goal (7) Wrist Shot, assists: Alex Pietrangelo (12), Tanner Pearson (5) |
 |
Goal | 2nd Period 2:49 | Jakub Vrana Goal (4) Snap Shot, assists: Aliaksei Protas (10), Rasmus Sandin (7) |
 |
Goal | 2nd Period 7:24 | Keegan Kolesar Goal (5) Wrist Shot, assists: Tomas Hertl (9), Jack Eichel (23) |
 |
Goal | 2nd Period 17:38 | Alex Ovechkin Goal (12) Wrist Shot, assists: Matt Roy (3) |
 |
Goal | 3rd Period 19:23 | Alex Ovechkin Goal (13) Backhand, assists: Aliaksei Protas (11), Martin Fehervary (4) |
Statistics
 WSH WSH |
 VGK VGK |
|
|---|---|---|
| 18 | Blocked Shots | 16 |
| 18 | Hits | 26 |
| 7 | Takeaways | 5 |
| 25 | Shots | 42 |
| 1 | Power Play Goals | 0 |
| 1 | Power Play Opportunities | 1 |
| 100.0 | Power Play Percentage | 0.0 |
| 0 | Short Handed Goals | 0 |
| 0 | Shootout Goals | 0 |
| 30 | Faceoffs Won | 41 |
| 42.3 | Faceoff Win Percent | 57.7 |
| 13 | Giveaways | 29 |
| 1 | Total Penalties | 1 |
| 2 | Penalty Minutes | 2 |
 Vegas Golden Knights Injuries
| NAME, POS | STATUS | DATE |
|---|---|---|
| Jack Eichel, C | Day-To-Day | Dec 22 |
 Washington Capitals Injuries
| NAME, POS | STATUS | DATE |
|---|---|---|
| Ryan Leonard, RW | Injured Reserve | Dec 20 |
Game Information
 T-Mobile Arena
Location: Las Vegas, NV
Attendance: 17,877 | Capacity:

Location: Las Vegas, NV
Attendance: 17,877 | Capacity:
2025-26 Metropolitan Division Standings
| TEAM | W | L | PTS | OTL |
|---|---|---|---|---|
 Carolina Carolina |
22 | 10 | 47 | 3 |
 Washington Washington |
19 | 12 | 43 | 5 |
 NY Islanders NY Islanders |
19 | 13 | 42 | 4 |
 Philadelphia Philadelphia |
17 | 10 | 41 | 7 |
 New Jersey New Jersey |
20 | 15 | 41 | 1 |
 NY Rangers NY Rangers |
18 | 16 | 40 | 4 |
 Pittsburgh Pittsburgh |
15 | 11 | 39 | 9 |
 Columbus Columbus |
14 | 15 | 34 | 6 |
2025-26 Pacific Division Standings
| TEAM | W | L | PTS | OTL |
|---|---|---|---|---|
 Anaheim Anaheim |
21 | 13 | 44 | 2 |
 Vegas Vegas |
16 | 8 | 42 | 10 |
 Edmonton Edmonton |
18 | 13 | 42 | 6 |
 Los Angeles Los Angeles |
15 | 10 | 39 | 9 |
 San Jose San Jose |
17 | 16 | 37 | 3 |
 Calgary Calgary |
15 | 17 | 34 | 4 |
 Vancouver Vancouver |
15 | 17 | 33 | 3 |
 Seattle Seattle |
13 | 14 | 32 | 6 |

