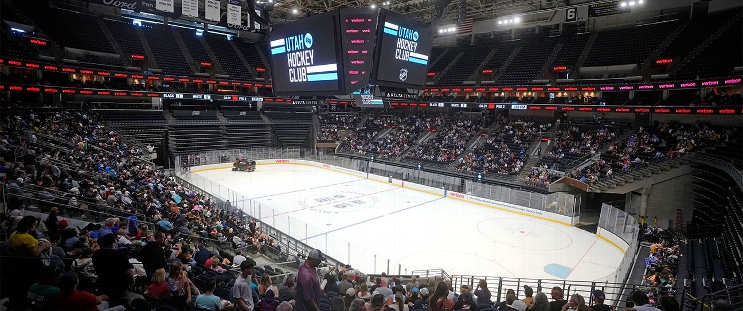
Vegas Golden Knights at Utah Hockey Club
· National Hockey LeagueKarlsson scores 2 late goals and Golden Knights rally for 4-2 win over Utah

Karlsson scored twice in the final 73 seconds, adding an empty-netter with 28.2 seconds left. Tomas Hertl had a pair of power-play goals to help Vegas erase a two-goal deficit. Adin Hill made 32 saves for the Golden Knights.
Logan Cooley and Mikhail Sergachev scored for Utah. Karel Vejmelka made 25 saves.
Cooley blasted in a 30-foot slap shot in the first period and Sergachev scored on a second-period power play to put Utah ahead 2-0.
Hertl got Vegas on the board when he tapped in the puck later in the second and then tied it in the third on another close-range blast.
Utah: Better-than-usual defensive form kept Utah competitive, but diminishing returns on offense in the third period made it tough to prevent a rally.
VGK leads series 2-0
Scoring Summary
 |
Goal | 1st Period 11:16 | Logan Cooley Goal (3) Slap Shot, assists: Matias Maccelli (6), Dylan Guenther (7) |
 |
Goal | 2nd Period 6:59 | Mikhail Sergachev Goal (4) Snap Shot, assists: Clayton Keller (9), Alexander Kerfoot (3) |
 |
Goal | 2nd Period 13:37 | Tomas Hertl Goal (6) Backhand, assists: Nicolas Roy (7), Jack Eichel (21) |
 |
Goal | 3rd Period 8:23 | Tomas Hertl Goal (7) Snap Shot, assists: William Karlsson (5), Jack Eichel (22) |
 |
Goal | 3rd Period 18:42 | William Karlsson Goal (3) Tip-In, assists: Kaedan Korczak (3), Cole Schwindt (5) |
 |
Goal | 3rd Period 19:31 | William Karlsson Goal (4) Backhand, assists: none |
Statistics
 VGK VGK |
 UTAH UTAH |
|
|---|---|---|
| 25 | Blocked Shots | 8 |
| 30 | Hits | 12 |
| 7 | Takeaways | 3 |
| 29 | Shots | 32 |
| 2 | Power Play Goals | 1 |
| 3 | Power Play Opportunities | 4 |
| 66.7 | Power Play Percentage | 25.0 |
| 0 | Short Handed Goals | 0 |
| 0 | Shootout Goals | 0 |
| 25 | Faceoffs Won | 39 |
| 39.1 | Faceoff Win Percent | 60.9 |
| 11 | Giveaways | 14 |
| 6 | Total Penalties | 4 |
| 23 | Penalty Minutes | 11 |
 Utah Hockey Club Injuries
| NAME, POS | STATUS | DATE |
|---|
 Vegas Golden Knights Injuries
| NAME, POS | STATUS | DATE |
|---|
Game Information
 Delta Center
Location: Salt Lake City, UT
Attendance: 11,131 | Capacity:

Location: Salt Lake City, UT
Attendance: 11,131 | Capacity:
2025-26 Pacific Division Standings
| TEAM | W | L | PTS | OTL |
|---|---|---|---|---|
 Edmonton Edmonton |
20 | 16 | 46 | 6 |
 Vegas Vegas |
17 | 11 | 45 | 11 |
 Anaheim Anaheim |
21 | 17 | 45 | 3 |
 Seattle Seattle |
18 | 14 | 43 | 7 |
 Los Angeles Los Angeles |
17 | 14 | 43 | 9 |
 San Jose San Jose |
20 | 18 | 43 | 3 |
 Calgary Calgary |
18 | 19 | 40 | 4 |
 Vancouver Vancouver |
16 | 20 | 37 | 5 |
2025-26 Central Division Standings
| TEAM | W | L | PTS | OTL |
|---|---|---|---|---|
 Colorado Colorado |
31 | 2 | 69 | 7 |
 Minnesota Minnesota |
25 | 10 | 58 | 8 |
 Dallas Dallas |
25 | 9 | 57 | 7 |
 Nashville Nashville |
19 | 18 | 42 | 4 |
 St. Louis St. Louis |
17 | 18 | 42 | 8 |
 Utah Utah |
19 | 20 | 41 | 3 |
 Chicago Chicago |
16 | 18 | 39 | 7 |
 Winnipeg Winnipeg |
15 | 21 | 34 | 4 |

