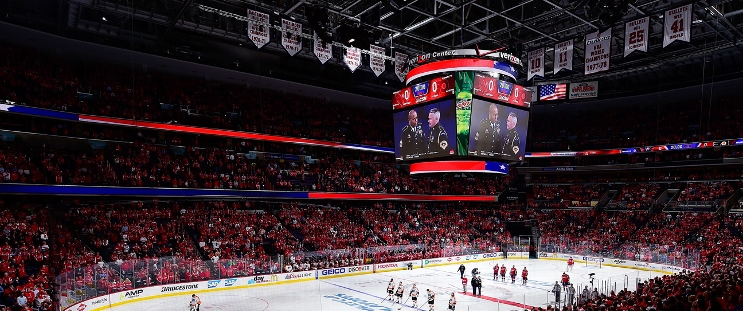
Toronto Maple Leafs at Washington Capitals
· National Hockey LeagueJohn Tavares scores in OT as the Maple Leafs rally to beat the Capitals 4-3

William Nylander sparked the comeback with his goal with 4:09 left and set up Marner's 6-on-4 power play goal with 47.8 seconds left in regulation with goaltender Joseph Woll pulled for an extra attacker and Washington's Nic Dowd in the penalty box. Nylander's heroics came 24 hours after his turnover on the first shift put the Leafs on track to a dud of a shutout loss at home against Ottawa.
The Capitals led 3-1 on goals by Taylor Raddysh, Dylan Strome and Aliaksei Protas before a turnover by Tom Wilson ended with Nylander beating Logan Thompson. Dowd's penalty became one mistake too many, and Washington lost for just the fifth time in 15 games this season.
Woll stopped 24 of the 27 shots he faced to help Toronto bounce back. Thompson had 31 saves and lost for the first time since Washington acquired him from Vegas last summer.
Capitals: After a charmed start to the season, the Capitals failed to add on and paid the price for a lackluster third period.
TOR leads series 1-0
Scoring Summary
 |
Goal | 1st Period 11:12 | Taylor Raddysh Goal (3) Backhand, assists: Connor McMichael (7), Pierre-Luc Dubois (8) |
 |
Goal | 1st Period 12:11 | Bobby McMann Goal (4) Snap Shot, assists: John Tavares (7), Pontus Holmberg (2) |
 |
Goal | 1st Period 18:33 | Dylan Strome Goal (5) Snap Shot, assists: Aliaksei Protas (9), Matt Roy (2) |
 |
Goal | 2nd Period 17:48 | Aliaksei Protas Goal (6) Snap Shot, assists: Rasmus Sandin (6), Alex Ovechkin (9) |
 |
Goal | 3rd Period 15:51 | William Nylander Goal (12) Snap Shot, assists: Matthew Knies (4) |
 |
Goal | 3rd Period 19:12 | Mitch Marner Goal (5) Slap Shot, assists: Morgan Rielly (9), William Nylander (8) |
 |
Goal | 4th Period 4:13 | John Tavares Goal (9) Snap Shot, assists: Mitch Marner (17) |
Statistics
 TOR TOR |
 WSH WSH |
|
|---|---|---|
| 12 | Blocked Shots | 15 |
| 13 | Hits | 21 |
| 5 | Takeaways | 3 |
| 34 | Shots | 27 |
| 1 | Power Play Goals | 0 |
| 2 | Power Play Opportunities | 1 |
| 50.0 | Power Play Percentage | 0.0 |
| 0 | Short Handed Goals | 0 |
| 0 | Shootout Goals | 0 |
| 25 | Faceoffs Won | 29 |
| 46.3 | Faceoff Win Percent | 53.7 |
| 10 | Giveaways | 17 |
| 1 | Total Penalties | 2 |
| 2 | Penalty Minutes | 4 |
Game Information
 Capital One Arena
Location: Washington, DC
Attendance: 18,573 | Capacity:

Location: Washington, DC
Attendance: 18,573 | Capacity:
2024-25 Atlantic Division Standings
| TEAM | W | L | PTS | OTL |
|---|---|---|---|---|
 Toronto Toronto |
13 | 6 | 28 | 2 |
 Florida Florida |
12 | 9 | 25 | 1 |
 Tampa Bay Tampa Bay |
11 | 7 | 24 | 2 |
 Buffalo Buffalo |
11 | 9 | 23 | 1 |
 Boston Boston |
10 | 10 | 23 | 3 |
 Detroit Detroit |
9 | 10 | 20 | 2 |
 Ottawa Ottawa |
9 | 11 | 19 | 1 |
 Montreal Montreal |
7 | 11 | 17 | 3 |
2024-25 Metropolitan Division Standings
| TEAM | W | L | PTS | OTL |
|---|---|---|---|---|
 New Jersey New Jersey |
15 | 7 | 32 | 2 |
 Carolina Carolina |
15 | 5 | 31 | 1 |
 Washington Washington |
14 | 6 | 29 | 1 |
 NY Rangers NY Rangers |
12 | 7 | 25 | 1 |
 NY Islanders NY Islanders |
8 | 9 | 21 | 5 |
 Philadelphia Philadelphia |
9 | 10 | 21 | 3 |
 Columbus Columbus |
9 | 9 | 20 | 2 |
 Pittsburgh Pittsburgh |
7 | 12 | 18 | 4 |

