
San Jose Sharks at Philadelphia Flyers
· National Hockey LeagueMatvei Michkov helps the Flyers beat the Sharks 4-3 in shootout

Michkov returned to the lineup after he was a healthy scratch for two consecutive games.
Travis Konecny and Erik Johnson also scored for the Flyers, who had lost three of four.
Mikael Granlund had a goal and an assist for the Sharks. William Eklund and Barclay Goodrow also scored in regulation for San Jose.
After both teams missed their first shots in the tiebreaker, Michkov deked from his backhand to his forehand to beat Vitek Vanecek. Konecny then clinched it with a shot high over Vanecek.
Only Nashville (11 points) and Montreal (10) entered with fewer points than San Jose and Philadelphia, with each beginning play with 12 points.
Michkov was the No. 7 overall pick in the 2023 draft from Russia. The 19-year-old forward was scratched on Philadelphia’s recent road trip to Florida by coach John Tortorella, who apparently wasn’t pleased with the rookie’s play away from the puck in recent games.
Samuel Ersson made 28 saves for the Flyers. Vanecek had 40 stops.
Flyers: Philadelphia is clearly a better offensive team with Michkov in the lineup.
PHI leads series 1-0
Scoring Summary
 |
Goal | 1st Period 1:40 | Erik Johnson Goal (1) Wrist Shot, assists: Anthony Richard (1) |
 |
Goal | 1st Period 15:56 | Travis Konecny Goal (8) Snap Shot, assists: Matvei Michkov (7), Emil Andrae (2) |
 |
Goal | 2nd Period 5:09 | Matvei Michkov Goal (5) Wrist Shot, assists: Ryan Poehling (6), Egor Zamula (3) |
 |
Goal | 2nd Period 15:29 | Jack Thompson Goal (2) Deflected, assists: William Eklund (8), Mikael Granlund (11) |
 |
Goal | 2nd Period 18:33 | Mikael Granlund Goal (7) Wrist Shot, assists: William Eklund (9), Fabian Zetterlund (5) |
 |
Goal | 3rd Period 17:36 | Barclay Goodrow Goal (2) Snap Shot, assists: Henry Thrun (5), Cody Ceci (3) |
 |
Goal | 5 0:00 | Matvei Michkov Goal Wrist Shot |
 |
Goal | 5 0:00 | Travis Konecny Goal Wrist Shot |
Statistics
 SJ SJ |
 PHI PHI |
|
|---|---|---|
| 19 | Blocked Shots | 10 |
| 21 | Hits | 23 |
| 2 | Takeaways | 12 |
| 31 | Shots | 43 |
| 0 | Power Play Goals | 1 |
| 3 | Power Play Opportunities | 3 |
| 0.0 | Power Play Percentage | 33.3 |
| 0 | Short Handed Goals | 0 |
| 0 | Shootout Goals | 0 |
| 31 | Faceoffs Won | 31 |
| 50.0 | Faceoff Win Percent | 50.0 |
| 15 | Giveaways | 14 |
| 5 | Total Penalties | 5 |
| 16 | Penalty Minutes | 16 |
Game Information
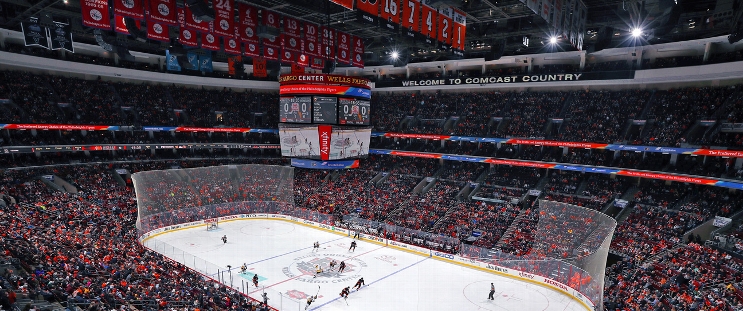 Wells Fargo Center
Location: Philadelphia, PA
Attendance: 18,706 | Capacity:

Location: Philadelphia, PA
Attendance: 18,706 | Capacity:
2024-25 Pacific Division Standings
| TEAM | W | L | PTS | OTL |
|---|---|---|---|---|
 Vegas Vegas |
28 | 9 | 59 | 3 |
 Edmonton Edmonton |
25 | 12 | 53 | 3 |
 Los Angeles Los Angeles |
23 | 10 | 51 | 5 |
 Vancouver Vancouver |
18 | 12 | 45 | 9 |
 Calgary Calgary |
19 | 14 | 45 | 7 |
 Anaheim Anaheim |
17 | 18 | 39 | 5 |
 Seattle Seattle |
17 | 21 | 37 | 3 |
 San Jose San Jose |
13 | 24 | 32 | 6 |
2024-25 Metropolitan Division Standings
| TEAM | W | L | PTS | OTL |
|---|---|---|---|---|
 Washington Washington |
26 | 10 | 56 | 4 |
 New Jersey New Jersey |
25 | 15 | 53 | 3 |
 Carolina Carolina |
24 | 15 | 50 | 2 |
 Columbus Columbus |
18 | 17 | 42 | 6 |
 Pittsburgh Pittsburgh |
17 | 17 | 42 | 8 |
 Philadelphia Philadelphia |
17 | 19 | 39 | 5 |
 NY Rangers NY Rangers |
18 | 20 | 38 | 2 |
 NY Islanders NY Islanders |
15 | 18 | 37 | 7 |

