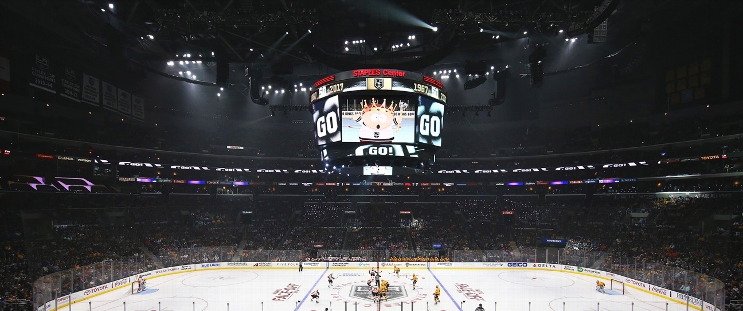
Columbus Blue Jackets at Los Angeles Kings
· National Hockey LeagueKings shake off slow start to beat Blue Jackets 5-2

Los Angeles is 4-1-1 over its past six games. That is also the Kings’ mark on home ice to start the season, picking up where they left off after posting the league’s best record following the All-Star break in 2023-24.
The Kings overcame a sluggish first period, falling behind on Dmitri Voronkov’s goal, before they took charge with Vladislav Gavrikov’s shot through several screens and Warren Foegele’s finish off the rush 1:56 apart in the second.
Ivan Provorov had a power-play goal for the Blue Jackets, who have lost four straight, with three of those defeats coming in regulation. It was their first loss in five games when leading after the first period this season.
Brandt Clarke added an empty-netter in the final minute for Los Angeles, and David Rittich had 24 saves.
Kings: Samuel Helenius, a 2021 second-round pick, made his NHL debut and got his first career point with the secondary assist on Foegele’s goal.
LA leads series 1-0
Scoring Summary
 |
Goal | 1st Period 13:26 | Dmitri Voronkov Goal (1) Tip-In, assists: Justin Danforth (3) |
 |
Goal | 2nd Period 4:16 | Vladislav Gavrikov Goal (2) Snap Shot, assists: Adrian Kempe (8), Anze Kopitar (11) |
 |
Goal | 2nd Period 6:12 | Warren Foegele Goal (6) Wrist Shot, assists: Akil Thomas (1), Samuel Helenius (1) |
 |
Goal | 3rd Period 0:30 | Trevor Moore Goal (2) Snap Shot, assists: Phillip Danault (8) |
 |
Goal | 3rd Period 0:49 | Ivan Provorov Goal (1) Wrist Shot, assists: Justin Danforth (4), Adam Fantilli (4) |
 |
Goal | 3rd Period 7:05 | Alex Laferriere Goal (9) Tip-In, assists: Joel Edmundson (3), Warren Foegele (3) |
 |
Goal | 3rd Period 19:29 | Brandt Clarke Goal (2) Wrist Shot, assists: Anze Kopitar (12), Adrian Kempe (9) |
Statistics
 CBJ CBJ |
 LA LA |
|
|---|---|---|
| 12 | Blocked Shots | 22 |
| 16 | Hits | 8 |
| 4 | Takeaways | 5 |
| 26 | Shots | 23 |
| 1 | Power Play Goals | 1 |
| 3 | Power Play Opportunities | 4 |
| 33.3 | Power Play Percentage | 25.0 |
| 0 | Short Handed Goals | 1 |
| 0 | Shootout Goals | 0 |
| 25 | Faceoffs Won | 33 |
| 43.1 | Faceoff Win Percent | 56.9 |
| 10 | Giveaways | 14 |
| 5 | Total Penalties | 4 |
| 13 | Penalty Minutes | 11 |
Game Information
 crypto.com Arena
Location: Los Angeles, CA
Attendance: 18,145 | Capacity:

Location: Los Angeles, CA
Attendance: 18,145 | Capacity:
2024-25 Metropolitan Division Standings
| TEAM | W | L | PTS | OTL |
|---|---|---|---|---|
 Washington Washington |
26 | 10 | 56 | 4 |
 New Jersey New Jersey |
25 | 15 | 53 | 3 |
 Carolina Carolina |
24 | 15 | 50 | 2 |
 Columbus Columbus |
18 | 17 | 42 | 6 |
 Pittsburgh Pittsburgh |
17 | 17 | 42 | 8 |
 Philadelphia Philadelphia |
17 | 19 | 39 | 5 |
 NY Rangers NY Rangers |
18 | 20 | 38 | 2 |
 NY Islanders NY Islanders |
15 | 18 | 37 | 7 |
2024-25 Pacific Division Standings
| TEAM | W | L | PTS | OTL |
|---|---|---|---|---|
 Vegas Vegas |
28 | 9 | 59 | 3 |
 Edmonton Edmonton |
25 | 12 | 53 | 3 |
 Los Angeles Los Angeles |
23 | 10 | 51 | 5 |
 Vancouver Vancouver |
18 | 12 | 45 | 9 |
 Calgary Calgary |
19 | 14 | 45 | 7 |
 Anaheim Anaheim |
17 | 18 | 39 | 5 |
 Seattle Seattle |
17 | 21 | 37 | 3 |
 San Jose San Jose |
13 | 24 | 32 | 6 |

