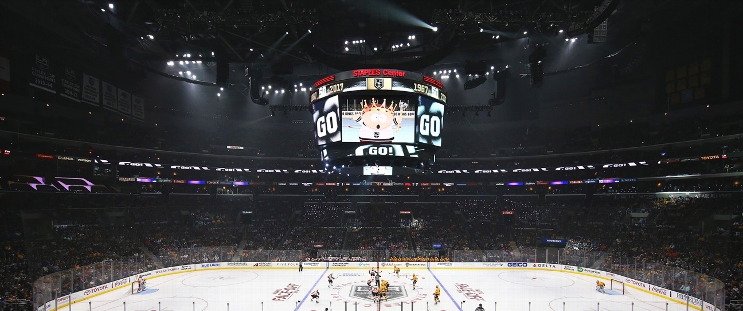
Vancouver Canucks at Los Angeles Kings
· National Hockey LeagueHughes continues hot streak, Canucks overcome loss of Boeser to beat Kings 4-2

Boeser, who scored a career-high 40 goals last season and leads Vancouver with six goals this year, did not return after taking an illegal check to the head from Kings forward Tanner Jeannot.
Conor Garland scored on the subsequent five-minute power play after Jeannot received a match penalty, tying the score at 1. Jake DeBrusk and J.T. Miller also scored, and Kevin Lankinen made 25 saves.
Quinton Byfield and Vladislav Gavrikov scored for Los Angeles, and Darcy Kuemper finished with 19 saves.
Kings defenseman Mikey Anderson also left the game because of injury. He was cut badly after taking Filip Hronek’s shot to the face late in the second period.
Kings: Byfield scored for the second straight game after failing to find the net through the 13 opening contests to start the season.
VAN leads series 1-0
Scoring Summary
 |
Goal | 1st Period 1:43 | Quinton Byfield Goal (2) Backhand, assists: Alex Laferriere (6), Warren Foegele (2) |
 |
Goal | 1st Period 14:20 | Conor Garland Goal (4) , assists: none |
 |
Goal | 2nd Period 5:51 | Jake DeBrusk Goal (3) Wrist Shot, assists: Quinn Hughes (11), Filip Hronek (4) |
 |
Goal | 3rd Period 2:44 | Quinn Hughes Goal (3) Wrist Shot, assists: none |
 |
Goal | 3rd Period 13:57 | Vladislav Gavrikov Goal (1) Wrist Shot, assists: Trevor Moore (7), Phillip Danault (7) |
 |
Goal | 3rd Period 18:46 | J.T. Miller Goal (5) Wrist Shot, assists: none |
Statistics
 VAN VAN |
 LA LA |
|
|---|---|---|
| 18 | Blocked Shots | 21 |
| 33 | Hits | 26 |
| 4 | Takeaways | 3 |
| 23 | Shots | 28 |
| 1 | Power Play Goals | 0 |
| 3 | Power Play Opportunities | 4 |
| 33.3 | Power Play Percentage | 0.0 |
| 0 | Short Handed Goals | 0 |
| 0 | Shootout Goals | 0 |
| 25 | Faceoffs Won | 24 |
| 51.0 | Faceoff Win Percent | 49.0 |
| 11 | Giveaways | 15 |
| 6 | Total Penalties | 4 |
| 12 | Penalty Minutes | 11 |
Game Information
 crypto.com Arena
Location: Los Angeles, CA
Attendance: 17,855 | Capacity:

Location: Los Angeles, CA
Attendance: 17,855 | Capacity:
2024-25 Pacific Division Standings
| TEAM | W | L | PTS | OTL |
|---|---|---|---|---|
 Vegas Vegas |
28 | 9 | 59 | 3 |
 Edmonton Edmonton |
25 | 12 | 53 | 3 |
 Los Angeles Los Angeles |
23 | 10 | 51 | 5 |
 Vancouver Vancouver |
18 | 12 | 45 | 9 |
 Calgary Calgary |
19 | 14 | 45 | 7 |
 Anaheim Anaheim |
17 | 18 | 39 | 5 |
 Seattle Seattle |
17 | 21 | 37 | 3 |
 San Jose San Jose |
13 | 24 | 32 | 6 |

