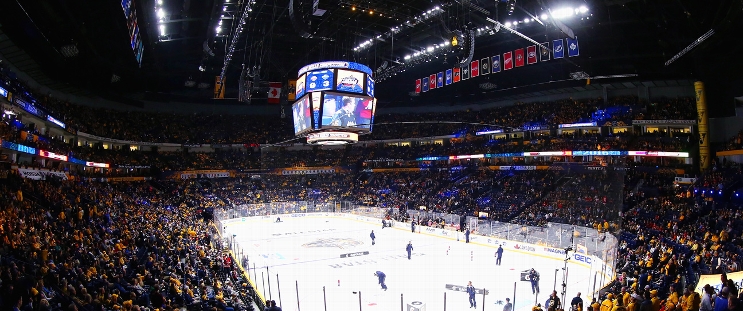
Los Angeles Kings at Nashville Predators
· National Hockey LeagueDarcy Kuemper makes 16 saves for 32nd career shutout in the Kings' 3-0 victory over the Predators

Adrian Kempe had a goal and an assist and Anze Kopitar and Kevin Fiala also scored. The Kings have won two of their last three.
Juuse Saros made 24 saves for the Predators. They are 1-2-1 in their last four.
Kopitar opened the scoring with 6:36 remaining in the opening period. Saros denied the Kings captain’s first shot, but Kopitar collected the rebound below the goal line and banked it off the netminder’s skate.
Fiala, a former Predator, made it 2-0 35 seconds into the third.
The Kings held Nashville to just three third-period shots on goal, the first coming with 3:55 remaining and Saros pulled for an extra attacker.
Predators: The Predators continue their struggle to score goals. Nashville’s opponents have scored first in nine of 12 games this season. The Predators entered Monday 26th in the NHL with 2.64 goals per game.
LA leads series 1-0
Scoring Summary
 |
Goal | 1st Period 13:24 | Anze Kopitar Goal (5) Wrist Shot, assists: Brandt Clarke (11), Adrian Kempe (7) |
 |
Goal | 3rd Period 0:35 | Kevin Fiala Goal (6) Wrist Shot, assists: Phillip Danault (5), Trevor Moore (4) |
 |
Goal | 3rd Period 17:02 | Adrian Kempe Goal (5) Wrist Shot, assists: Trevor Lewis (2), Vladislav Gavrikov (4) |
Statistics
 LA LA |
 NSH NSH |
|
|---|---|---|
| 12 | Blocked Shots | 14 |
| 12 | Hits | 21 |
| 8 | Takeaways | 3 |
| 27 | Shots | 16 |
| 0 | Power Play Goals | 0 |
| 4 | Power Play Opportunities | 3 |
| 0.0 | Power Play Percentage | 0.0 |
| 0 | Short Handed Goals | 0 |
| 0 | Shootout Goals | 0 |
| 30 | Faceoffs Won | 25 |
| 54.5 | Faceoff Win Percent | 45.5 |
| 10 | Giveaways | 11 |
| 6 | Total Penalties | 7 |
| 18 | Penalty Minutes | 20 |
Game Information
 Bridgestone Arena
Location: Nashville, TN
Attendance: 17,168 | Capacity:

Location: Nashville, TN
Attendance: 17,168 | Capacity:
2024-25 Pacific Division Standings
| TEAM | W | L | PTS | OTL |
|---|---|---|---|---|
 Vegas Vegas |
16 | 7 | 35 | 3 |
 Los Angeles Los Angeles |
14 | 8 | 31 | 3 |
 Vancouver Vancouver |
13 | 7 | 30 | 4 |
 Calgary Calgary |
13 | 9 | 30 | 4 |
 Edmonton Edmonton |
13 | 10 | 28 | 2 |
 Seattle Seattle |
12 | 13 | 25 | 1 |
 San Jose San Jose |
10 | 13 | 25 | 5 |
 Anaheim Anaheim |
10 | 10 | 23 | 3 |
2024-25 Central Division Standings
| TEAM | W | L | PTS | OTL |
|---|---|---|---|---|
 Minnesota Minnesota |
17 | 4 | 38 | 4 |
 Winnipeg Winnipeg |
18 | 8 | 36 | 0 |
 Dallas Dallas |
16 | 8 | 32 | 0 |
 Colorado Colorado |
14 | 12 | 28 | 0 |
 St. Louis St. Louis |
12 | 12 | 26 | 2 |
 Utah Utah |
10 | 11 | 24 | 4 |
 Nashville Nashville |
7 | 12 | 20 | 6 |
 Chicago Chicago |
8 | 15 | 18 | 2 |

