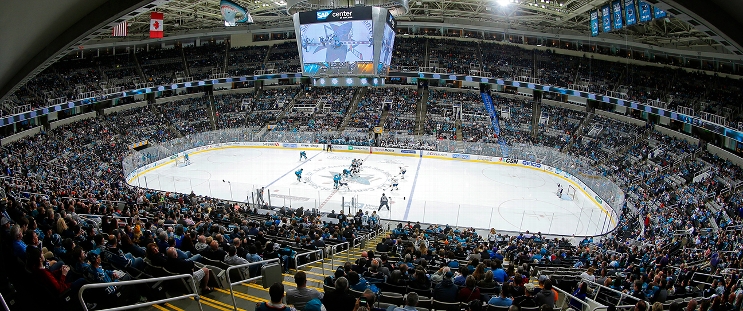
Chicago Blackhawks at San Jose Sharks
· National Hockey LeagueWill Smith scores twice for first NHL goals, Sharks beat Blackhawks 3-2 for third straight win

The Sharks have won three straight after going winless in their first nine games, while the Blackhawks have dropped five of their last six.
On a power play midway through the second period, Smith – the fourth overall pick in the 2023 draft – scored the winning goal with a wrist shot off the crossbar.
Ryan Donato and Tyler Bertuzzi scored 50 seconds apart in the first period to give Chicago a 2-1 lead, with Connor Murphy assisting on both goals. Donato's goal was 37 seconds after Smith opened the scoring.
Alexander Wennberg tied the game at 2 early in the second for San Jose.
Mackenzie Blackwood and Petr Mrazek each stopped 26 shots, but Blackwood will be credited with the win.
Sharks: San Jose had just one three-game win streak last season, when it finished with the worst record in the league.
Series tied 1-1
Scoring Summary
 |
Goal | 1st Period 6:52 | Will Smith Goal (1) Wrist Shot, assists: Luke Kunin (2), Cody Ceci (2) |
 |
Goal | 1st Period 7:29 | Ryan Donato Goal (6) Snap Shot, assists: Ilya Mikheyev (1), Connor Murphy (5) |
 |
Goal | 1st Period 8:19 | Tyler Bertuzzi Goal (3) Wrist Shot, assists: Connor Murphy (6), Taylor Hall (2) |
 |
Goal | 2nd Period 1:30 | Alexander Wennberg Goal (2) Poke, assists: Fabian Zetterlund (2), Jake Walman (8) |
 |
Goal | 2nd Period 10:42 | Will Smith Goal (2) Wrist Shot, assists: none |
Statistics
 CHI CHI |
 SJ SJ |
|
|---|---|---|
| 9 | Blocked Shots | 26 |
| 13 | Hits | 20 |
| 7 | Takeaways | 7 |
| 29 | Shots | 29 |
| 0 | Power Play Goals | 1 |
| 3 | Power Play Opportunities | 1 |
| 0.0 | Power Play Percentage | 100.0 |
| 0 | Short Handed Goals | 0 |
| 0 | Shootout Goals | 0 |
| 16 | Faceoffs Won | 25 |
| 39.0 | Faceoff Win Percent | 61.0 |
| 13 | Giveaways | 13 |
| 1 | Total Penalties | 3 |
| 2 | Penalty Minutes | 6 |
Game Information
 SAP Center at San Jose
Location: San Jose, CA
Attendance: 10,315 | Capacity:

Location: San Jose, CA
Attendance: 10,315 | Capacity:
2024-25 Central Division Standings
| TEAM | W | L | PTS | OTL |
|---|---|---|---|---|
 Winnipeg Winnipeg |
31 | 14 | 65 | 3 |
 Minnesota Minnesota |
28 | 15 | 60 | 4 |
 Dallas Dallas |
29 | 17 | 59 | 1 |
 Colorado Colorado |
28 | 19 | 57 | 1 |
 St. Louis St. Louis |
23 | 21 | 50 | 4 |
 Utah Utah |
20 | 19 | 47 | 7 |
 Nashville Nashville |
17 | 22 | 41 | 7 |
 Chicago Chicago |
15 | 28 | 34 | 4 |
2024-25 Pacific Division Standings
| TEAM | W | L | PTS | OTL |
|---|---|---|---|---|
 Vegas Vegas |
29 | 14 | 62 | 4 |
 Edmonton Edmonton |
29 | 15 | 61 | 3 |
 Los Angeles Los Angeles |
25 | 14 | 55 | 5 |
 Calgary Calgary |
22 | 16 | 51 | 7 |
 Vancouver Vancouver |
20 | 16 | 50 | 10 |
 Seattle Seattle |
21 | 24 | 45 | 3 |
 Anaheim Anaheim |
18 | 23 | 42 | 6 |
 San Jose San Jose |
14 | 30 | 34 | 6 |

