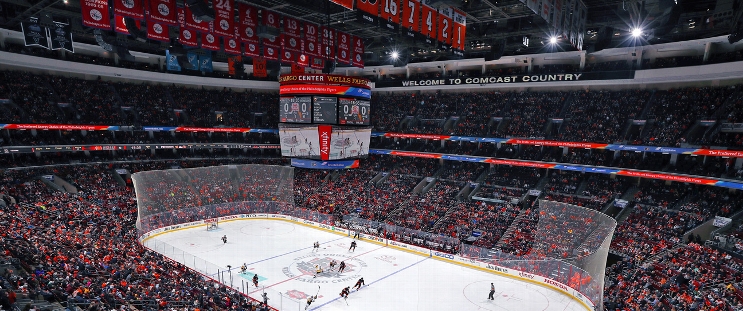
St. Louis Blues at Philadelphia Flyers
· National Hockey LeagueBobby Brink breaks late tie, Flyers beat Blues 2-1 for 2nd straight victoiry

Garnet Hathaway also scored and Sam Ersson made 20 saves to help Philadelphia win consecutive games for the first time this season. St. Louis has lost three straight and four of five.
Hathaway opened the scoring midway through the first period on a nice feed from Ryan Poehlinfgm who weaved through the defense and slid a backhand pass to his linemate.
Ersson followed up his shutout Tuesday night at Boston with another strong performance. His only blemish came midway through the third period when Nathan Walker snapped a shot past him off a carom off Flyers defenseman Travis Sanheim’s skate on a shot by Philip Broberg.
Flyers: Philadelphia has struggled to generate offense this season, so earlier in the week, it modified its plan to be more defensive-minded. The plan is to take away the middle of the ice, keep teams to the outside and block a lot of shots. They executed it to perfection again, blocking 24 shots two days after blocking 28 at Boston.
PHI leads series 1-0
Scoring Summary
 |
Goal | 1st Period 11:12 | Garnet Hathaway Goal (1) Wrist Shot, assists: Ryan Poehling (5), Nick Seeler (2) |
 |
Goal | 3rd Period 9:58 | Nathan Walker Goal (1) Wrist Shot, assists: Philip Broberg (7), Zack Bolduc (3) |
 |
Goal | 3rd Period 16:59 | Bobby Brink Goal (2) Tip-In, assists: Joel Farabee (4), Scott Laughton (3) |
Statistics
 STL STL |
 PHI PHI |
|
|---|---|---|
| 14 | Blocked Shots | 24 |
| 24 | Hits | 10 |
| 4 | Takeaways | 8 |
| 21 | Shots | 21 |
| 0 | Power Play Goals | 0 |
| 2 | Power Play Opportunities | 3 |
| 0.0 | Power Play Percentage | 0.0 |
| 0 | Short Handed Goals | 0 |
| 0 | Shootout Goals | 0 |
| 20 | Faceoffs Won | 23 |
| 46.5 | Faceoff Win Percent | 53.5 |
| 8 | Giveaways | 10 |
| 3 | Total Penalties | 2 |
| 6 | Penalty Minutes | 4 |
Game Information
 Wells Fargo Center
Location: Philadelphia, PA
Attendance: 14,122 | Capacity:

Location: Philadelphia, PA
Attendance: 14,122 | Capacity:
2024-25 Central Division Standings
| TEAM | W | L | PTS | OTL |
|---|---|---|---|---|
 Winnipeg Winnipeg |
44 | 17 | 92 | 4 |
 Dallas Dallas |
42 | 20 | 86 | 2 |
 Colorado Colorado |
39 | 24 | 80 | 2 |
 Minnesota Minnesota |
36 | 24 | 76 | 4 |
 St. Louis St. Louis |
31 | 27 | 69 | 7 |
 Utah Utah |
28 | 25 | 67 | 11 |
 Nashville Nashville |
24 | 32 | 55 | 7 |
 Chicago Chicago |
20 | 36 | 49 | 9 |
2024-25 Metropolitan Division Standings
| TEAM | W | L | PTS | OTL |
|---|---|---|---|---|
 Washington Washington |
42 | 14 | 92 | 8 |
 Carolina Carolina |
38 | 22 | 80 | 4 |
 New Jersey New Jersey |
34 | 25 | 74 | 6 |
 Columbus Columbus |
31 | 24 | 70 | 8 |
 NY Rangers NY Rangers |
31 | 27 | 68 | 6 |
 NY Islanders NY Islanders |
29 | 27 | 65 | 7 |
 Philadelphia Philadelphia |
27 | 30 | 62 | 8 |
 Pittsburgh Pittsburgh |
25 | 31 | 60 | 10 |

