
Los Angeles Kings at San Jose Sharks
· National Hockey LeagueToffoli scores 3rd-period goal to lift Sharks to 4-2 win over Kings

Walman scored one goal and had two assists, Fabian Zetterlund scored a key third-period goal, and William Eklund added an empty-netter. Walman had three assists in Monday’s 5-4 overtime victory over Utah.
Sharks goalie Vitek Vanecek had 26 saves.
Akil Thomas and Alex Laferriere scored for the Kings and David Rittich turned back 17 shots.
Forward Ethan Cardwell made his NHL debut Tuesday, logging just under 12 minutes of ice time after the Sharks recalled the 22-year-old from the San Jose Barracuda earlier in the day. San Jose placed forward Ty Dellandrea on the injured list earlier in a corresponding move.
Series tied 1-1
Scoring Summary
 |
Goal | 2nd Period 2:20 | Jake Walman Goal (1) Slap Shot, assists: Nico Sturm (2), Carl Grundstrom (2) |
 |
Goal | 2nd Period 3:18 | Akil Thomas Goal (1) Wrist Shot, assists: Brandt Clarke (7), Trevor Moore (2) |
 |
Goal | 3rd Period 6:25 | Fabian Zetterlund Goal (6) Wrist Shot, assists: Alexander Wennberg (4), Jake Walman (6) |
 |
Goal | 3rd Period 8:52 | Alex Laferriere Goal (5) Wrist Shot, assists: Warren Foegele (1) |
 |
Goal | 3rd Period 11:02 | Tyler Toffoli Goal (6) Backhand, assists: Jake Walman (7) |
 |
Goal | 3rd Period 19:22 | William Eklund Goal (2) Wrist Shot, assists: Luke Kunin (1), Mario Ferraro (2) |
Statistics
 LA LA |
 SJ SJ |
|
|---|---|---|
| 11 | Blocked Shots | 24 |
| 15 | Hits | 21 |
| 10 | Takeaways | 6 |
| 28 | Shots | 21 |
| 0 | Power Play Goals | 0 |
| 6 | Power Play Opportunities | 4 |
| 0.0 | Power Play Percentage | 0.0 |
| 0 | Short Handed Goals | 0 |
| 0 | Shootout Goals | 0 |
| 33 | Faceoffs Won | 24 |
| 57.9 | Faceoff Win Percent | 42.1 |
| 13 | Giveaways | 12 |
| 4 | Total Penalties | 6 |
| 8 | Penalty Minutes | 12 |
Game Information
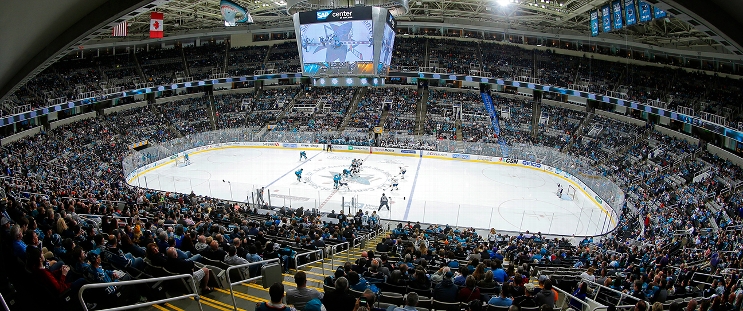 SAP Center at San Jose
Location: San Jose, CA
Attendance: 10,818 | Capacity:

Location: San Jose, CA
Attendance: 10,818 | Capacity:
2024-25 Pacific Division Standings
| TEAM | W | L | PTS | OTL |
|---|---|---|---|---|
 Vegas Vegas |
16 | 7 | 35 | 3 |
 Los Angeles Los Angeles |
14 | 8 | 31 | 3 |
 Vancouver Vancouver |
13 | 7 | 30 | 4 |
 Calgary Calgary |
13 | 9 | 30 | 4 |
 Edmonton Edmonton |
13 | 10 | 28 | 2 |
 Seattle Seattle |
12 | 13 | 25 | 1 |
 San Jose San Jose |
10 | 13 | 25 | 5 |
 Anaheim Anaheim |
10 | 10 | 23 | 3 |
