Carolina Hurricanes at Vancouver Canucks
· National Hockey LeagueAho scores in OT to give Hurricanes 4-3 win over Canucks

Martin Necas had a goal and an assist, and William Carrier and Jack Roslovic also scored in regulation for the Hurricanes, who won their fourth straight. Pyotr Kochetkov finished with 25 saves.
Brock Boeser and Quinn Hughes each had a goal and an assist for the Canucks, and Pius Suter got the tying goal late in the third period. J.T. Miller had two assists and Kevin Lankinen had 28 saves.
Canucks: Vancouver fell behind 3-1 early in the second period and battled to make up the difference, outshooting the Hurricanes 12-10 in the middle period and 11-8 in the third.
CAR leads series 1-0
Scoring Summary
 |
Goal | 1st Period 5:40 | William Carrier Goal (1) Slap Shot, assists: Jackson Blake (2), Jack Drury (2) |
 |
Goal | 1st Period 7:17 | Brock Boeser Goal (5) Snap Shot, assists: J.T. Miller (4), Quinn Hughes (6) |
 |
Goal | 1st Period 15:33 | Martin Necas Goal (4) Wrist Shot, assists: Jesperi Kotkaniemi (6), Eric Robinson (3) |
 |
Goal | 2nd Period 1:53 | Jack Roslovic Goal (4) Wrist Shot, assists: Brent Burns (3), Andrei Svechnikov (5) |
 |
Goal | 3rd Period 7:56 | Quinn Hughes Goal (2) Slap Shot, assists: Brock Boeser (4), J.T. Miller (5) |
 |
Goal | 3rd Period 16:55 | Pius Suter Goal (2) Wrist Shot, assists: Daniel Sprong (2), Nils Hoglander (2) |
 |
Goal | 4th Period 0:47 | Sebastian Aho Goal (3) Backhand, assists: Shayne Gostisbehere (3), Martin Necas (7) |
Statistics
 CAR CAR |
 VAN VAN |
|
|---|---|---|
| 12 | Blocked Shots | 8 |
| 23 | Hits | 28 |
| 3 | Takeaways | 3 |
| 32 | Shots | 27 |
| 0 | Power Play Goals | 0 |
| 3 | Power Play Opportunities | 3 |
| 0.0 | Power Play Percentage | 0.0 |
| 0 | Short Handed Goals | 0 |
| 0 | Shootout Goals | 0 |
| 26 | Faceoffs Won | 28 |
| 48.1 | Faceoff Win Percent | 51.9 |
| 13 | Giveaways | 11 |
| 3 | Total Penalties | 3 |
| 6 | Penalty Minutes | 6 |
Game Information
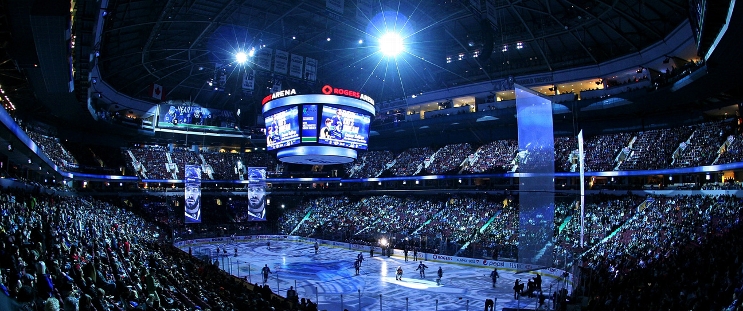
 Rogers Arena
Location: Vancouver, BC
Attendance: 18,682 | Capacity:

Location: Vancouver, BC
Attendance: 18,682 | Capacity:
2024-25 Metropolitan Division Standings
| TEAM | W | L | PTS | OTL |
|---|---|---|---|---|
 Washington Washington |
32 | 10 | 69 | 5 |
 Carolina Carolina |
29 | 16 | 61 | 3 |
 New Jersey New Jersey |
26 | 17 | 58 | 6 |
 Columbus Columbus |
22 | 18 | 51 | 7 |
 NY Rangers NY Rangers |
23 | 20 | 50 | 4 |
 Philadelphia Philadelphia |
22 | 20 | 50 | 6 |
 Pittsburgh Pittsburgh |
20 | 21 | 48 | 8 |
 NY Islanders NY Islanders |
19 | 20 | 45 | 7 |
2024-25 Pacific Division Standings
| TEAM | W | L | PTS | OTL |
|---|---|---|---|---|
 Vegas Vegas |
29 | 14 | 62 | 4 |
 Edmonton Edmonton |
29 | 15 | 61 | 3 |
 Los Angeles Los Angeles |
25 | 14 | 55 | 5 |
 Calgary Calgary |
22 | 16 | 51 | 7 |
 Vancouver Vancouver |
20 | 15 | 50 | 10 |
 Seattle Seattle |
21 | 24 | 45 | 3 |
 Anaheim Anaheim |
18 | 22 | 42 | 6 |
 San Jose San Jose |
14 | 30 | 34 | 6 |

