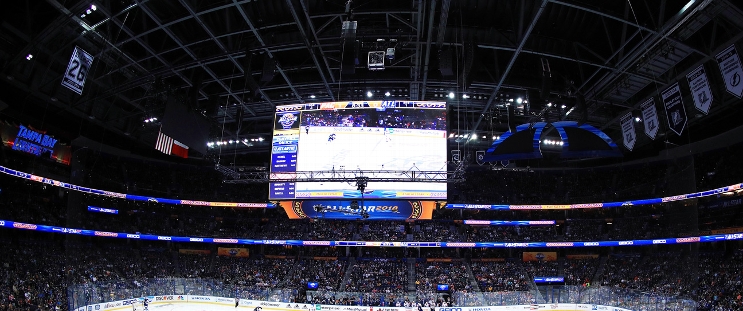
Nashville Predators at Tampa Bay Lightning
· National Hockey LeaguePaul scores in OT, Lightning beat Predators 3-2 in Stamkos' return to Tampa

Brayden Point had a goal and an assist, and Mitchell Chaffee also scored to give the Lightning a 2-0 lead in the first period. Andrei Vasilevskiy made 35 saves.
Stamkos, who played his first 16 NHL seasons with the Lightning before signing with Nashville on July 1, received a standing ovation after being honored with a video tribute in the first period. His assist on Ryan O’Reilly’s power-play goal midway through the second period was his first with the Predators, and he got his second by setting up Gustav Nyquist’s game-tying goal at 18:40.
But Paul won it by beating Juuse Saros after the Predators had dominated overtime.
Saros stopped 24 shots for Nashville.
Lightning: Tampa Bay, which had the NHL’s best power play last season at 28.6 percent, was 0 for 3 and fell to 5 for 31 (16.1 percent) overall and 0 for 14 at home.
----
Regular Season SeriesTB leads series 1-0
Scoring Summary
 |
Goal | 1st Period 9:49 | Brayden Point Goal (6) Backhand, assists: Jake Guentzel (6) |
 |
Goal | 1st Period 19:24 | Mitchell Chaffee Goal (3) Wrist Shot, assists: Brayden Point (3) |
 |
Goal | 2nd Period 10:19 | Ryan O'Reilly Goal (3) Wrist Shot, assists: Jonathan Marchessault (4), Steven Stamkos (1) |
 |
Goal | 2nd Period 18:40 | Gustav Nyquist Goal (3) Wrist Shot, assists: Steven Stamkos (2), Brady Skjei (4) |
 |
Goal | 4th Period 3:22 | Nick Paul Goal (3) Wrist Shot, assists: Jake Guentzel (7) |
Statistics
 NSH NSH |
 TB TB |
|
|---|---|---|
| 21 | Blocked Shots | 13 |
| 33 | Hits | 13 |
| 1 | Takeaways | 1 |
| 37 | Shots | 27 |
| 1 | Power Play Goals | 0 |
| 4 | Power Play Opportunities | 3 |
| 25.0 | Power Play Percentage | 0.0 |
| 0 | Short Handed Goals | 0 |
| 0 | Shootout Goals | 0 |
| 32 | Faceoffs Won | 32 |
| 50.0 | Faceoff Win Percent | 50.0 |
| 13 | Giveaways | 11 |
| 3 | Total Penalties | 4 |
| 6 | Penalty Minutes | 8 |
Game Information
 Amalie Arena
Location: Tampa, FL
Attendance: 19,092 | Capacity:

Location: Tampa, FL
Attendance: 19,092 | Capacity:
2024-25 Central Division Standings
| TEAM | W | L | PTS | OTL |
|---|---|---|---|---|
 Winnipeg Winnipeg |
31 | 14 | 65 | 3 |
 Minnesota Minnesota |
28 | 15 | 60 | 4 |
 Dallas Dallas |
29 | 17 | 59 | 1 |
 Colorado Colorado |
28 | 19 | 57 | 1 |
 St. Louis St. Louis |
23 | 21 | 50 | 4 |
 Utah Utah |
20 | 19 | 47 | 7 |
 Nashville Nashville |
17 | 22 | 41 | 7 |
 Chicago Chicago |
15 | 28 | 34 | 4 |
2024-25 Atlantic Division Standings
| TEAM | W | L | PTS | OTL |
|---|---|---|---|---|
 Toronto Toronto |
30 | 16 | 62 | 2 |
 Florida Florida |
27 | 17 | 57 | 3 |
 Tampa Bay Tampa Bay |
25 | 18 | 53 | 3 |
 Ottawa Ottawa |
24 | 19 | 52 | 4 |
 Montreal Montreal |
24 | 19 | 52 | 4 |
 Boston Boston |
23 | 19 | 52 | 6 |
 Detroit Detroit |
21 | 21 | 47 | 5 |
 Buffalo Buffalo |
17 | 24 | 39 | 5 |

