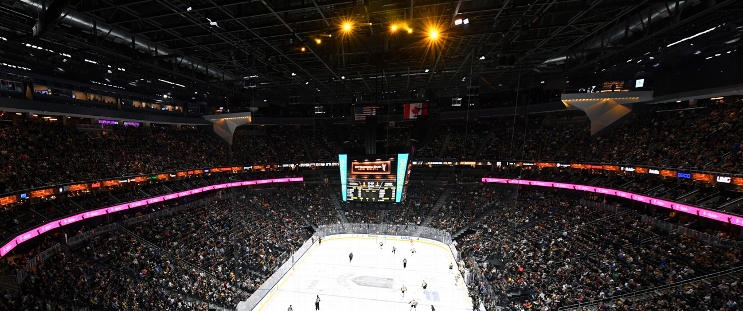
San Jose Sharks at Vegas Golden Knights
· National Hockey LeagueHowden scores twice as Golden Knights win 7-3 and hand Sharks ninth straight loss

William Karlsson, who missed the first eight games with an undisclosed injury, had a goal and an assist in his season debut for Vegas. Tanner Pearson, Jack Eichel and Pavel Dorofeyev also scored for the Golden Knights, and Ilya Samsonov made 24 saves.
Mikael Granlund, Nico Sturm and Luke Kunin scored for San Jose while Vitek Vanecek made 35 saves.
Vegas: For the first time in his 12-year career, Tomas Hertl stepped in for an opening puck drop against the Sharks. Hertl spent 11 seasons in San Jose before being traded last March. Hertl finished with two assists, stretching his point streak to three games (3 goals, 4 assists).
VGK leads series 1-0
Scoring Summary
 |
Goal | 1st Period 1:57 | Tanner Pearson Goal (2) Slap Shot, assists: William Karlsson (1), Alexander Holtz (2) |
 |
Goal | 1st Period 3:47 | Jack Eichel Goal (3) Slap Shot, assists: Mark Stone (12), Alex Pietrangelo (10) |
 |
Goal | 1st Period 16:46 | Brett Howden Goal (4) Wrist Shot, assists: Tomas Hertl (5), Pavel Dorofeyev (2) |
 |
Goal | 2nd Period 10:13 | Mikael Granlund Goal (4) Wrist Shot, assists: William Eklund (5), Mario Ferraro (1) |
 |
Goal | 2nd Period 11:10 | William Karlsson Goal (1) Wrist Shot, assists: Alex Pietrangelo (11) |
 |
Goal | 2nd Period 19:26 | Pavel Dorofeyev Goal (4) Slap Shot, assists: Shea Theodore (7), Mark Stone (13) |
 |
Goal | 2nd Period 19:41 | Nico Sturm Goal (1) Wrist Shot, assists: none |
 |
Goal | 3rd Period 11:10 | Mark Stone Goal (4) Wrist Shot, assists: Jack Eichel (12), Ivan Barbashev (5) |
 |
Goal | 3rd Period 13:29 | Luke Kunin Goal (2) Wrist Shot, assists: Fabian Zetterlund (1) |
 |
Goal | 3rd Period 17:07 | Brett Howden Goal (5) Wrist Shot, assists: Pavel Dorofeyev (3), Tomas Hertl (6) |
Statistics
 SJ SJ |
 VGK VGK |
|
|---|---|---|
| 16 | Blocked Shots | 13 |
| 35 | Hits | 17 |
| 6 | Takeaways | 6 |
| 26 | Shots | 42 |
| 0 | Power Play Goals | 1 |
| 2 | Power Play Opportunities | 4 |
| 0.0 | Power Play Percentage | 25.0 |
| 0 | Short Handed Goals | 1 |
| 0 | Shootout Goals | 0 |
| 26 | Faceoffs Won | 27 |
| 49.1 | Faceoff Win Percent | 50.9 |
| 7 | Giveaways | 12 |
| 4 | Total Penalties | 2 |
| 8 | Penalty Minutes | 4 |
Game Information
 T-Mobile Arena
Location: Las Vegas, NV
Attendance: 17,686 | Capacity:

Location: Las Vegas, NV
Attendance: 17,686 | Capacity:
2024-25 Pacific Division Standings
| TEAM | W | L | PTS | OTL |
|---|---|---|---|---|
 Vegas Vegas |
11 | 6 | 24 | 2 |
 Calgary Calgary |
10 | 6 | 23 | 3 |
 Los Angeles Los Angeles |
10 | 7 | 23 | 3 |
 Edmonton Edmonton |
10 | 8 | 22 | 2 |
 Vancouver Vancouver |
9 | 6 | 21 | 3 |
 Seattle Seattle |
10 | 9 | 21 | 1 |
 Anaheim Anaheim |
8 | 8 | 18 | 2 |
 San Jose San Jose |
6 | 11 | 16 | 4 |

