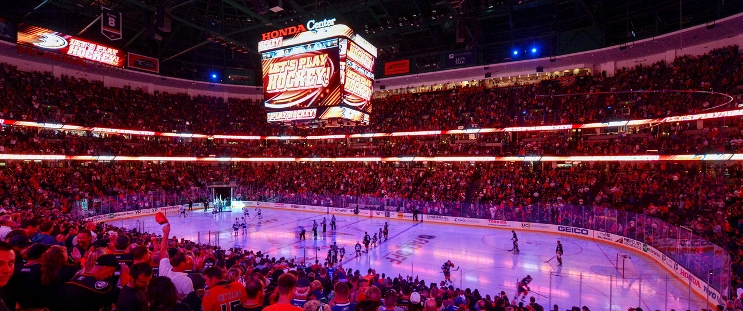
Los Angeles Kings at Anaheim Ducks
· National Hockey LeagueKings score 4 goals in 3rd period to beat Ducks 4-1

Vladislav Gavrikov had two assists and David Rittich made 15 saves for Los Angeles.
Ryan Strome scored for Anaheim with 1:46 remaining to bring the Ducks within a goal, but Fiala and Anderson followed with empty-netters 31 seconds apart to put the game away.
Lukas Dostal finished with 34 saves for Anaheim.
The Kings broke a scoreless tie at 3:06 of the third period when Kempe beat his defender to Anze Kopitar’s picturesque pass off the boards and slid the puck in between Dostal’s legs.
Just over five minutes later, Laferriere intercepted a cross-ice pass from Ducks defenseman Jackson Lacombe in front of the Anaheim net and fired a quick wrist shot under Dostal’s blocker.
Ducks: Anaheim had its worst offensive game of the young season. The Ducks scored 11 goals in their first four games and never had fewer than 20 shots on goal. Their offense disappeared for all but the final minutes against the Kings.
LA leads series 1-0
Scoring Summary
 |
Goal | 3rd Period 3:06 | Adrian Kempe Goal (3) Snap Shot, assists: Anze Kopitar (5), Mikey Anderson (2) |
 |
Goal | 3rd Period 8:58 | Alex Laferriere Goal (4) Snap Shot, assists: none |
 |
Goal | 3rd Period 18:16 | Ryan Strome Goal (2) Tip-In, assists: Troy Terry (1), Frank Vatrano (2) |
 |
Goal | 3rd Period 18:53 | Kevin Fiala Goal (4) Backhand, assists: Phillip Danault (2), Vladislav Gavrikov (3) |
 |
Goal | 3rd Period 19:24 | Mikey Anderson Goal (2) Wrist Shot, assists: Alex Turcotte (3) |
Statistics
 LA LA |
 ANA ANA |
|
|---|---|---|
| 11 | Blocked Shots | 17 |
| 20 | Hits | 20 |
| 8 | Takeaways | 3 |
| 36 | Shots | 14 |
| 0 | Power Play Goals | 0 |
| 2 | Power Play Opportunities | 3 |
| 0.0 | Power Play Percentage | 0.0 |
| 0 | Short Handed Goals | 0 |
| 0 | Shootout Goals | 0 |
| 33 | Faceoffs Won | 20 |
| 62.3 | Faceoff Win Percent | 37.7 |
| 12 | Giveaways | 10 |
| 3 | Total Penalties | 2 |
| 6 | Penalty Minutes | 4 |
Game Information
 Honda Center
Location: Anaheim, CA
Attendance: 16,098 | Capacity:

Location: Anaheim, CA
Attendance: 16,098 | Capacity:
2024-25 Pacific Division Standings
| TEAM | W | L | PTS | OTL |
|---|---|---|---|---|
 Vegas Vegas |
16 | 7 | 35 | 3 |
 Los Angeles Los Angeles |
14 | 8 | 31 | 3 |
 Vancouver Vancouver |
13 | 7 | 30 | 4 |
 Calgary Calgary |
13 | 9 | 30 | 4 |
 Edmonton Edmonton |
13 | 10 | 28 | 2 |
 Seattle Seattle |
12 | 13 | 25 | 1 |
 San Jose San Jose |
10 | 13 | 25 | 5 |
 Anaheim Anaheim |
10 | 10 | 23 | 3 |

