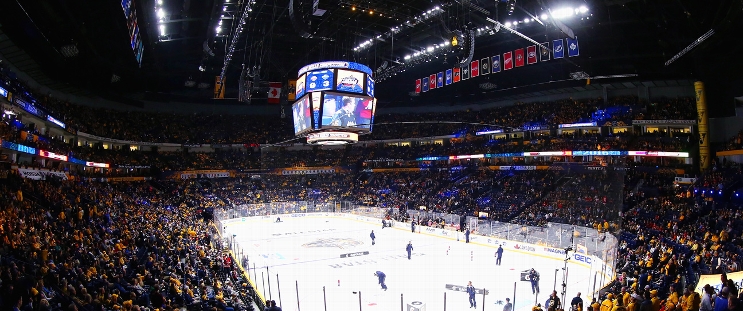
Detroit Red Wings at Nashville Predators
· National Hockey LeagueCopp's 2 goals lead Red Wings over reeling Predators 5-2

Vladimir Tarasenko, Dylan Larkin and Simon Edvinsson also scored for Detroit, which dropped three of its first four games this season.
Steven Stamkos scored his first goal for Nashville. Luke Schenn also scored, and Juuse Saros made 19 stops.
The Predators dropped to 0-5-0 this season. They are the only NHL team without a point.
Stamkos’ power-play goal 32 seconds into the third period was his first goal with the Predators. The veteran forward signed a $32 million, four-year contract in free agency.
Both of Detroit’s wins this season have come against Nashville.
Predators: Nashville is off to its worst start since 2002-03, when they were 0-4-1-2. But unlike the early days of the franchise when the payroll was small, Nashville spent big in free agency in the offseason, bringing in the likes of Stamkos, Jonathan Marchessault and Brady Skjei.
DET wins series 2-0
Scoring Summary
 |
Goal | 1st Period 8:48 | Luke Schenn Goal (1) Snap Shot, assists: Ryan O'Reilly (3), Gustav Nyquist (1) |
 |
Goal | 1st Period 13:26 | Vladimir Tarasenko Goal (2) Wrist Shot, assists: Jonatan Berggren (1), Marco Kasper (1) |
 |
Goal | 2nd Period 3:17 | Dylan Larkin Goal (3) Snap Shot, assists: Alex DeBrincat (2), Patrick Kane (2) |
 |
Goal | 3rd Period 0:32 | Steven Stamkos Goal (1) Slap Shot, assists: Filip Forsberg (3), Jonathan Marchessault (3) |
 |
Goal | 3rd Period 3:29 | Andrew Copp Goal (2) Deflected, assists: Joe Veleno (1), Christian Fischer (1) |
 |
Goal | 3rd Period 18:43 | Simon Edvinsson Goal (1) Wrist Shot, assists: none |
 |
Goal | 3rd Period 19:18 | Andrew Copp Goal (3) Wrist Shot, assists: Michael Rasmussen (1) |
Statistics
 DET DET |
 NSH NSH |
|
|---|---|---|
| 16 | Blocked Shots | 12 |
| 25 | Hits | 27 |
| 12 | Takeaways | 5 |
| 24 | Shots | 39 |
| 1 | Power Play Goals | 1 |
| 3 | Power Play Opportunities | 2 |
| 33.3 | Power Play Percentage | 50.0 |
| 0 | Short Handed Goals | 0 |
| 0 | Shootout Goals | 0 |
| 34 | Faceoffs Won | 29 |
| 54.0 | Faceoff Win Percent | 46.0 |
| 16 | Giveaways | 9 |
| 3 | Total Penalties | 4 |
| 6 | Penalty Minutes | 8 |
Game Information
 Bridgestone Arena
Location: Nashville, TN
Attendance: 17,159 | Capacity:

Location: Nashville, TN
Attendance: 17,159 | Capacity:
2024-25 Atlantic Division Standings
| TEAM | W | L | PTS | OTL |
|---|---|---|---|---|
 Toronto Toronto |
29 | 16 | 60 | 2 |
 Florida Florida |
27 | 17 | 57 | 3 |
 Tampa Bay Tampa Bay |
25 | 16 | 53 | 3 |
 Ottawa Ottawa |
24 | 18 | 52 | 4 |
 Montreal Montreal |
23 | 19 | 50 | 4 |
 Boston Boston |
22 | 19 | 50 | 6 |
 Detroit Detroit |
21 | 21 | 46 | 4 |
 Buffalo Buffalo |
17 | 23 | 39 | 5 |
2024-25 Central Division Standings
| TEAM | W | L | PTS | OTL |
|---|---|---|---|---|
 Winnipeg Winnipeg |
31 | 13 | 65 | 3 |
 Dallas Dallas |
29 | 16 | 59 | 1 |
 Minnesota Minnesota |
27 | 15 | 58 | 4 |
 Colorado Colorado |
28 | 18 | 57 | 1 |
 St. Louis St. Louis |
22 | 21 | 48 | 4 |
 Utah Utah |
19 | 19 | 45 | 7 |
 Nashville Nashville |
16 | 22 | 39 | 7 |
 Chicago Chicago |
15 | 28 | 33 | 3 |

