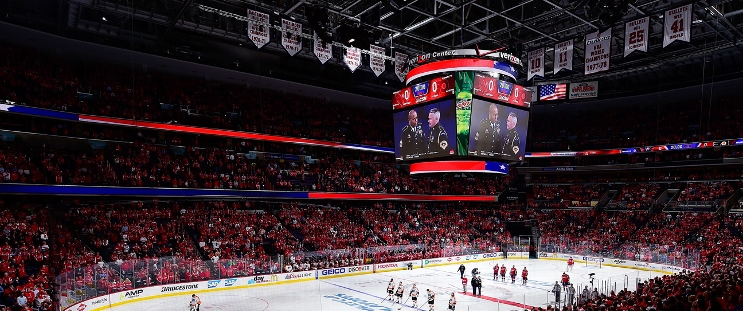
Vegas Golden Knights at Washington Capitals
· National Hockey LeagueCapitals end the Golden Knights' season-opening winning streak at 3 with a 4-2 victory

Ovechkin, who is chasing Wayne Gretzky's NHL career goals record, became the 60th player in league history to record 700 assists. He has three assists through Washington's first two games of the season and remains 42 away from breaking Gretzky's mark.
Jakub Vrana scored on his first shot in his return to the Capitals, with whom he won the Stanley Cup in 2018 when they beat Vegas in the final. Vrana made the team after attending camp on a tryout.
Jakob Chychrun also scored his first since joining Washington in a summer trade from Ottawa. Thompson, another one of a handful of newcomers from an offseason of change, beat the Golden Knights after they traded him rather than give him a bigger role.
Adin Hill, the goalie who backstopped Vegas to the Cup in '23, allowed four goals on 22 shots. Victor Olofsson and Jack Eichel scored for the Knights.
Capitals: Got their legs under them after starting much later than most teams, including their first two opponents.
WSH leads series 1-0
Scoring Summary
 |
Goal | 1st Period 6:02 | Jakub Vrana Goal (1) Snap Shot, assists: Andrew Mangiapane (1) |
 |
Goal | 1st Period 17:49 | Victor Olofsson Goal (3) Snap Shot, assists: Tomas Hertl (2), Mark Stone (5) |
 |
Goal | 2nd Period 3:06 | Tom Wilson Goal (2) Snap Shot, assists: Dylan Strome (2), Alex Ovechkin (2) |
 |
Goal | 2nd Period 5:16 | Aliaksei Protas Goal (1) Snap Shot, assists: Alex Ovechkin (3) |
 |
Goal | 2nd Period 6:13 | Jakob Chychrun Goal (1) Batted, assists: Nic Dowd (1), John Carlson (2) |
 |
Goal | 2nd Period 7:17 | Jack Eichel Goal (2) Wrist Shot, assists: Mark Stone (6), Ivan Barbashev (4) |
Statistics
 VGK VGK |
 WSH WSH |
|
|---|---|---|
| 15 | Blocked Shots | 13 |
| 9 | Hits | 24 |
| 1 | Takeaways | 5 |
| 26 | Shots | 22 |
| 1 | Power Play Goals | 1 |
| 4 | Power Play Opportunities | 3 |
| 25.0 | Power Play Percentage | 33.3 |
| 0 | Short Handed Goals | 0 |
| 0 | Shootout Goals | 0 |
| 25 | Faceoffs Won | 30 |
| 45.5 | Faceoff Win Percent | 54.5 |
| 7 | Giveaways | 13 |
| 3 | Total Penalties | 4 |
| 6 | Penalty Minutes | 8 |
Game Information
 Capital One Arena
Location: Washington, DC
Attendance: 16,727 | Capacity:

Location: Washington, DC
Attendance: 16,727 | Capacity:
2024-25 Pacific Division Standings
| TEAM | W | L | PTS | OTL |
|---|---|---|---|---|
 Vegas Vegas |
12 | 6 | 26 | 2 |
 Calgary Calgary |
11 | 6 | 25 | 3 |
 Los Angeles Los Angeles |
10 | 7 | 23 | 3 |
 Edmonton Edmonton |
10 | 9 | 22 | 2 |
 Vancouver Vancouver |
9 | 6 | 21 | 3 |
 Seattle Seattle |
10 | 9 | 21 | 1 |
 Anaheim Anaheim |
8 | 8 | 19 | 3 |
 San Jose San Jose |
6 | 11 | 17 | 5 |
2024-25 Metropolitan Division Standings
| TEAM | W | L | PTS | OTL |
|---|---|---|---|---|
 Carolina Carolina |
14 | 5 | 28 | 0 |
 New Jersey New Jersey |
13 | 7 | 28 | 2 |
 Washington Washington |
13 | 5 | 27 | 1 |
 NY Rangers NY Rangers |
12 | 5 | 25 | 1 |
 NY Islanders NY Islanders |
7 | 8 | 19 | 5 |
 Columbus Columbus |
8 | 9 | 18 | 2 |
 Philadelphia Philadelphia |
8 | 10 | 18 | 2 |
 Pittsburgh Pittsburgh |
7 | 11 | 18 | 4 |

