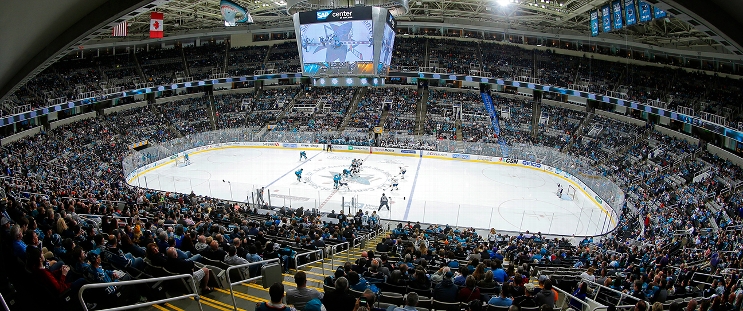
St. Louis Blues at San Jose Sharks
· National Hockey LeagueBlues spoil Celebrini's impressive debut with 5-4 overtime win over the Sharks

Justin Faulk tied it with 47 seconds left in regulation, and Schenn added the winner to give the Blues their second straight victory to open the season.
The Blues overcame a 4-1 deficit in the third to force overtime after getting goals from Radek Faksa, Ryan Suter and Faulk. Pavel Buchenivic also scored.
Joel Hofer made 25 saves,
Celebrini scored the first goal of the game and set up Tyler Toffoli for a goal later in the opening period. Fabian Zetterlund and Barclay Goodrow also scored for San Jose.
Mackenzie Blackwood made 35 saves.
Sharks: After five straight seasons of missing the playoffs, San Jose fans were starved for any sort of success. Celebrini showed the sellout crowd there is reason for optimism thanks to a new young star but the third period showed there is still plenty of work needed.
STL leads series 1-0
Scoring Summary
 |
Goal | 1st Period 7:01 | Macklin Celebrini Goal (1) Backhand, assists: William Eklund (1), Jake Walman (1) |
 |
Goal | 1st Period 8:51 | Pavel Buchnevich Goal (1) Wrist Shot, assists: Jordan Kyrou (1), Philip Broberg (1) |
 |
Goal | 1st Period 17:14 | Tyler Toffoli Goal (1) Snap Shot, assists: Macklin Celebrini (1), Jan Rutta (1) |
 |
Goal | 2nd Period 8:26 | Fabian Zetterlund Goal (1) Wrist Shot, assists: Mikael Granlund (1), Tyler Toffoli (1) |
 |
Goal | 2nd Period 17:37 | Barclay Goodrow Goal (1) Deflected, assists: none |
 |
Goal | 3rd Period 2:54 | Radek Faksa Goal (1) Wrist Shot, assists: Nathan Walker (1) |
 |
Goal | 3rd Period 6:11 | Ryan Suter Goal (1) Wrist Shot, assists: Alexey Toropchenko (1) |
 |
Goal | 3rd Period 19:13 | Justin Faulk Goal (1) Wrist Shot, assists: Robert Thomas (2), Jordan Kyrou (2) |
 |
Goal | 4th Period 0:45 | Brayden Schenn Goal (1) Wrist Shot, assists: Colton Parayko (1), Robert Thomas (3) |
Statistics
 STL STL |
 SJ SJ |
|
|---|---|---|
| 15 | Blocked Shots | 23 |
| 13 | Hits | 19 |
| 5 | Takeaways | 5 |
| 40 | Shots | 29 |
| 0 | Power Play Goals | 1 |
| 2 | Power Play Opportunities | 2 |
| 0.0 | Power Play Percentage | 50.0 |
| 0 | Short Handed Goals | 1 |
| 0 | Shootout Goals | 0 |
| 35 | Faceoffs Won | 25 |
| 58.3 | Faceoff Win Percent | 41.7 |
| 17 | Giveaways | 19 |
| 2 | Total Penalties | 2 |
| 4 | Penalty Minutes | 4 |
 San Jose Sharks Injuries
| NAME, POS | STATUS | DATE |
|---|---|---|
| Shakir Mukhamadullin, D | Out | Apr 17 |
| Zack Ostapchuk, C | Out | Apr 16 |
| Thomas Bordeleau, C | Out | Apr 16 |
| Vincent Desharnais, D | Out | Apr 15 |
| Logan Couture, C | Injured Reserve | Apr 14 |
 St. Louis Blues Injuries
| NAME, POS | STATUS | DATE |
|---|---|---|
| Dylan Holloway, C | Out | Apr 17 |
| Torey Krug, D | Injured Reserve | Oct 8 |
Game Information
 SAP Center at San Jose
Location: San Jose, CA
Attendance: 17,435 | Capacity:

Location: San Jose, CA
Attendance: 17,435 | Capacity:
2024-25 Central Division Standings
| TEAM | W | L | PTS | OTL |
|---|---|---|---|---|
 Winnipeg Winnipeg |
56 | 22 | 116 | 4 |
 Dallas Dallas |
50 | 26 | 106 | 6 |
 Colorado Colorado |
49 | 29 | 102 | 4 |
 Minnesota Minnesota |
45 | 30 | 97 | 7 |
 St. Louis St. Louis |
44 | 30 | 96 | 8 |
 Utah Utah |
38 | 31 | 89 | 13 |
 Nashville Nashville |
30 | 44 | 68 | 8 |
 Chicago Chicago |
25 | 46 | 61 | 11 |
2024-25 Pacific Division Standings
| TEAM | W | L | PTS | OTL |
|---|---|---|---|---|
 Vegas Vegas |
50 | 22 | 110 | 10 |
 Los Angeles Los Angeles |
48 | 25 | 105 | 9 |
 Edmonton Edmonton |
48 | 29 | 101 | 5 |
 Calgary Calgary |
41 | 27 | 96 | 14 |
 Vancouver Vancouver |
38 | 30 | 90 | 14 |
 Anaheim Anaheim |
35 | 37 | 80 | 10 |
 Seattle Seattle |
35 | 41 | 76 | 6 |
 San Jose San Jose |
20 | 50 | 52 | 12 |

