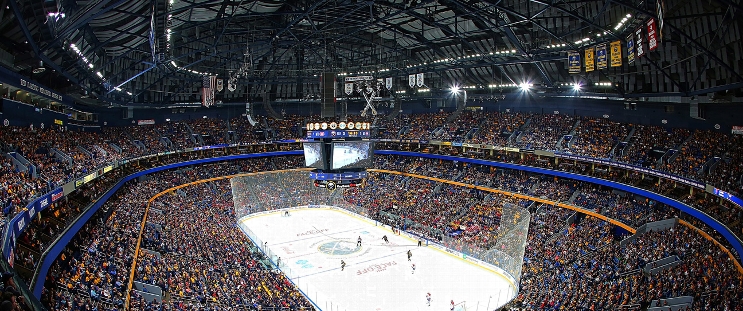
Los Angeles Kings at Buffalo Sabres
· National Hockey LeagueAnze Kopitar scores natural third-period hat trick to rally the Kings over the Sabres

Darcy Kuemper stopped 32 shots in an outing where the Kings overcame a 1-0 deficit. Kopitar tied the game at 1-1 by scoring 13 seconds into the third period. He scored the go-ahead goal on a power play with 1:38 left and then capped the scoring with an empty-netter.
Alex Tuch converted his own rebound on a shorthanded breakaway with 3:05 left in the second period, and Buffalo dropped to 0-3 after opening the season with two losses to New Jersey in Prague last weekend.
Sabres: Scoring remains an issue for a team that managed one goal in each of its two season-opening losses to New Jersey. Buffalo’s power play is now 0-of-10 after failing on all five chances against the Kings, including a two-man advantage spanning 69 seconds in the first period.
LA leads series 1-0
Scoring Summary
 |
Goal | 2nd Period 16:55 | Alex Tuch Goal (1) Snap Shot, assists: none |
 |
Goal | 3rd Period 0:13 | Anze Kopitar Goal (1) Snap Shot, assists: Alex Laferriere (1), Joel Edmundson (1) |
 |
Goal | 3rd Period 18:22 | Anze Kopitar Goal (2) Slap Shot, assists: Jordan Spence (1), Kevin Fiala (1) |
 |
Goal | 3rd Period 19:18 | Anze Kopitar Goal (3) Wrist Shot, assists: Quinton Byfield (1), Adrian Kempe (1) |
Statistics
 LA LA |
 BUF BUF |
|
|---|---|---|
| 19 | Blocked Shots | 15 |
| 20 | Hits | 29 |
| 2 | Takeaways | 8 |
| 23 | Shots | 33 |
| 1 | Power Play Goals | 0 |
| 5 | Power Play Opportunities | 5 |
| 20.0 | Power Play Percentage | 0.0 |
| 0 | Short Handed Goals | 1 |
| 0 | Shootout Goals | 0 |
| 25 | Faceoffs Won | 35 |
| 41.7 | Faceoff Win Percent | 58.3 |
| 12 | Giveaways | 14 |
| 6 | Total Penalties | 8 |
| 15 | Penalty Minutes | 35 |
 Buffalo Sabres Injuries
| NAME, POS | STATUS | DATE |
|---|---|---|
| Owen Power, D | Out | Apr 19 |
| Beck Malenstyn, LW | Out | Apr 17 |
| Josh Norris, C | Out | Apr 15 |
| Jordan Greenway, LW | Out | Apr 12 |
 Los Angeles Kings Injuries
| NAME, POS | STATUS | DATE |
|---|---|---|
| Tanner Jeannot, LW | Out | Apr 20 |
Game Information
 KeyBank Center
Location: Buffalo, NY
Attendance: 19,070 | Capacity:

Location: Buffalo, NY
Attendance: 19,070 | Capacity:
2024-25 Pacific Division Standings
| TEAM | W | L | PTS | OTL |
|---|---|---|---|---|
 Vegas Vegas |
50 | 22 | 110 | 10 |
 Los Angeles Los Angeles |
48 | 25 | 105 | 9 |
 Edmonton Edmonton |
48 | 29 | 101 | 5 |
 Calgary Calgary |
41 | 27 | 96 | 14 |
 Vancouver Vancouver |
38 | 30 | 90 | 14 |
 Anaheim Anaheim |
35 | 37 | 80 | 10 |
 Seattle Seattle |
35 | 41 | 76 | 6 |
 San Jose San Jose |
20 | 50 | 52 | 12 |
2024-25 Atlantic Division Standings
| TEAM | W | L | PTS | OTL |
|---|---|---|---|---|
 Toronto Toronto |
52 | 26 | 108 | 4 |
 Tampa Bay Tampa Bay |
47 | 27 | 102 | 8 |
 Florida Florida |
47 | 31 | 98 | 4 |
 Ottawa Ottawa |
45 | 30 | 97 | 7 |
 Montreal Montreal |
40 | 31 | 91 | 11 |
 Detroit Detroit |
39 | 35 | 86 | 8 |
 Buffalo Buffalo |
36 | 39 | 79 | 7 |
 Boston Boston |
33 | 39 | 76 | 10 |

