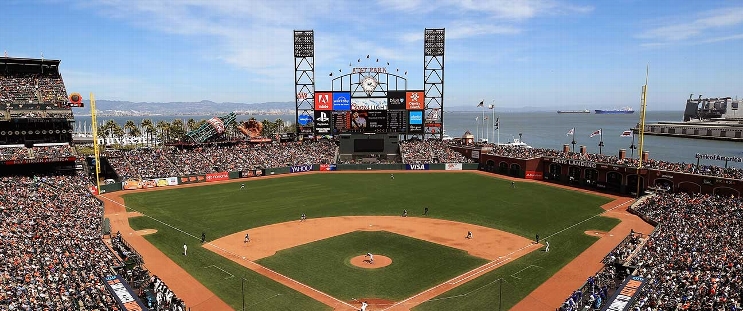
Texas Rangers at San Francisco Giants
· Major League Baseball
2 - 0

Eovaldi outlasts Verlander as Rangers beay Giants 2-0

Wyatt Langford had three hits and an RBI to help the Rangers win in manager Bruce Bochy’s return to Oracle Park.
Eovaldi (2-2) allowed three hits and had seven strikeouts with one walk in his 300th career game in the majors while outdueling three-time Cy Young Award winner Justin Verlander. The walk was just the third allowed by Eovaldi in 36 2/3 innings this season.
Chris Martin retired four batters, Robert Garcia set down three and Luke Jackson worked the ninth for his eighth save.
Wilmer Flores came close to tying the game in the ninth when his long drive to left went foul. Jackson then threw an 88 mph slider past Flores for the final out.
Verlander (0-2), whose 21 career victories against the Rangers are second against Texas, allowed two runs and five hits in six innings.
Bochy, who guided the Giants to three World Series championships, was welcomed back into town and greeted with a rousing ovation from the Oracle Park crowd. He spent much of pregame talking with fans and signing autographs.
How can I watch Texas Rangers vs. San Francisco Giants?
- TV Channel: Rangers at Giants 2022 MLB Baseball, is broadcasted on Apple TV+.
- Online streaming: Sign up for Fubo.
Scoring Summary
 |
9th Inning | Flores struck out looking. |
 |
9th Inning | Chapman grounded out to first. |
 |
9th Inning | Jackson relieved R. Garcia |
 |
9th Inning | Lee struck out swinging. |
 |
9th Inning | Jung struck out swinging. |
 |
9th Inning | Semien flied out to right. |
Statistics
 TEX TEX |
 SF SF |
|
|---|---|---|
| 1 | Games Played | 1 |
| 1 | Team Games Played | 1 |
| 0 | Hit By Pitch | 0 |
| 6 | Ground Balls | 7 |
| 10 | Strikeouts | 13 |
| 2 | Runs Batted In | 0 |
| 0 | Sacrifice Hit | 0 |
| 7 | Hits | 4 |
| 0 | Stolen Bases | 0 |
| 1 | Walks | 1 |
| 0 | Catcher Interference | 0 |
| 2 | Runs | 0 |
| 1 | Ground Into Double Play | 0 |
| 0 | Sacrifice Flies | 0 |
| 32 | At Bats | 31 |
| 0 | Home Runs | 0 |
| 0 | Grand Slam Home Runs | 0 |
| 11 | Runners Left On Base | 10 |
| 0 | Triples | 0 |
| 1 | Game Winning RBIs | 0 |
| 0 | Intentional Walks | 0 |
| 3 | Doubles | 0 |
| 16 | Fly Balls | 11 |
| 1 | Caught Stealing | 0 |
| 127 | Pitches | 142 |
| 0 | Games Started | 0 |
| 0 | Pinch At Bats | 0 |
| 0 | Pinch Hits | 0 |
| 0.0 | Player Rating | 0.0 |
| 1 | Is Qualified | 1 |
| 1 | Is Qualified In Steals | 0 |
| 10 | Total Bases | 4 |
| 33 | Plate Appearances | 32 |
| 0.0 | Projected Home Runs | 0.0 |
| 3 | Extra Base Hits | 0 |
| 1.6 | Runs Created | -0.4 |
| .219 | Batting Average | .129 |
| .000 | Pinch Hit Average | .000 |
| .313 | Slugging Percentage | .129 |
| .094 | Secondary Average | .032 |
| .242 | On Base Percentage | .156 |
| .555 | OBP Pct + SLG Pct | .285 |
| 0.4 | Ground To Fly Ball Ratio | 0.6 |
| 1.6 | Runs Created Per 27 Outs | -0.4 |
| 21.0 | Batter Rating | 4.0 |
| 0.0 | At Bats Per Home Run | 0.0 |
| 0.00 | Stolen Base Percentage | 0.00 |
| 3.85 | Pitches Per Plate Appearance | 4.44 |
| .094 | Isolated Power | .000 |
| 0.10 | Walk To Strikeout Ratio | 0.08 |
| .030 | Walks Per Plate Appearance | .031 |
| -.125 | Secondary Average Minus Batting Average | -.097 |
| 4.0 | Runs Produced | 0.0 |
| 1.0 | Runs Ratio | 0.0 |
| 0.3 | Patience Ratio | 0.2 |
| 0.3 | Balls In Play Average | 0.2 |
| 71.3 | MLB Rating | 57.3 |
| 0.0 | Offensive Wins Above Replacement | 0.0 |
| 0.0 | Wins Above Replacement | 0.0 |
Game Information

Location: San Francisco, California
Attendance: 40,080 | Capacity:
2025 American League West Standings
| TEAM | W | L | PCT | GB | STRK |
|---|---|---|---|---|---|
 Texas Texas |
15 | 11 | .577 | - | W1 |
 Seattle Seattle |
14 | 12 | .538 | 1 | L1 |
 Houston Houston |
13 | 12 | .520 | 1.5 | L1 |
 Athletics Athletics |
13 | 13 | .500 | 2 | W3 |
 Los Angeles Los Angeles |
12 | 14 | .462 | 3 | L2 |
2025 National League West Standings
| TEAM | W | L | PCT | GB | STRK |
|---|---|---|---|---|---|
 San Diego San Diego |
17 | 9 | .654 | - | L2 |
 San Francisco San Francisco |
17 | 10 | .630 | 0.5 | L1 |
 Los Angeles Los Angeles |
16 | 10 | .615 | 1 | L3 |
 Arizona Arizona |
14 | 12 | .538 | 3 | L3 |
 Colorado Colorado |
4 | 21 | .160 | 12.5 | L4 |