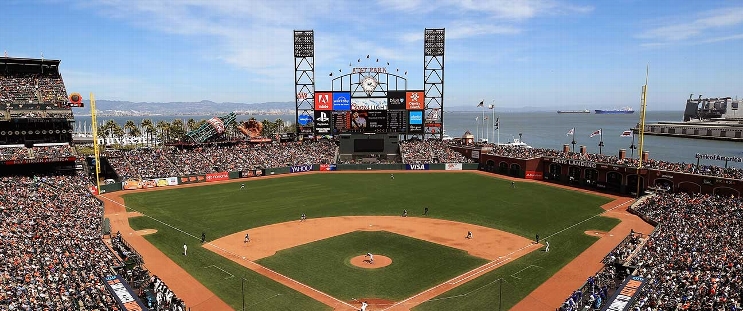
Milwaukee Brewers at San Francisco Giants
· Major League Baseball
5 - 6

Yastrzemski and Chapman homers help Giants rally past the Brewers 6-5

Yastrzemski hit a solo homer, finished with two RBI and scored twice. Chapman hit his fifth homer of the season, a two-run shot, in the fifth inning.
San Francisco trailed 5-4 when Tyler Fitzgerald opened the eighth by drawing a walk from Tyler Alexander (1-2). Fitzgerald moved to third on a single by pinch-hitter Wilmer Flores and a groundout moved pinch-runner Christian Koss to second.
Yastrzemski hit a grounder to second baseman Brice Turang, who was playing in. Turang’s throw to the plate was high and Fitzgerald slid safely to tie the game at 5, with Koss moving to third.
Trevor Megill replaced Alexander and Willy Adames, a former Milwaukee shortstop, pulled a liner to left that was misplayed by Christian Yelich. Koss scored on the sacrifice fly and Adames reached on the Yelich error.
Reliever Tyler Rogers (2-0) struck out three in the eighth inning. Camilo Doval worked the ninth and earned his fifth save.
Yelich, Rhys Hoskins and Sal Frelick had RBI hits for the Brewers.
How can I watch Milwaukee Brewers vs. San Francisco Giants?
- TV Channel: Brewers at Giants 2022 MLB Baseball, is broadcasted on MLB.TV.
- Online streaming: Sign up for Fubo.
Scoring Summary
 |
9th Inning | Hoskins flied out to center. |
 |
9th Inning | Yelich singled to center, Durbin to second. |
 |
9th Inning | Frelick flied out to left. |
 |
9th Inning | Turang flied out to left. |
 |
9th Inning | Durbin walked. |
 |
9th Inning | Doval relieved Rogers |
Statistics
 MIL MIL |
 SF SF |
|
|---|---|---|
| 1 | Games Played | 1 |
| 1 | Team Games Played | 1 |
| 0 | Hit By Pitch | 0 |
| 16 | Ground Balls | 12 |
| 7 | Strikeouts | 4 |
| 3 | Runs Batted In | 6 |
| 1 | Sacrifice Hit | 0 |
| 9 | Hits | 7 |
| 2 | Stolen Bases | 0 |
| 6 | Walks | 7 |
| 0 | Catcher Interference | 0 |
| 5 | Runs | 6 |
| 1 | Ground Into Double Play | 0 |
| 1 | Sacrifice Flies | 1 |
| 32 | At Bats | 32 |
| 0 | Home Runs | 2 |
| 0 | Grand Slam Home Runs | 0 |
| 17 | Runners Left On Base | 25 |
| 0 | Triples | 0 |
| 0 | Game Winning RBIs | 1 |
| 0 | Intentional Walks | 0 |
| 1 | Doubles | 1 |
| 11 | Fly Balls | 17 |
| 1 | Caught Stealing | 0 |
| 151 | Pitches | 167 |
| 0 | Games Started | 0 |
| 0 | Pinch At Bats | 1 |
| 0 | Pinch Hits | 1 |
| 0.0 | Player Rating | 0.0 |
| 1 | Is Qualified | 1 |
| 1 | Is Qualified In Steals | 0 |
| 10 | Total Bases | 14 |
| 40 | Plate Appearances | 40 |
| 0.0 | Projected Home Runs | 324.0 |
| 1 | Extra Base Hits | 3 |
| 4.5 | Runs Created | 5.6 |
| .281 | Batting Average | .219 |
| .000 | Pinch Hit Average | 1.000 |
| .313 | Slugging Percentage | .438 |
| .250 | Secondary Average | .438 |
| .385 | On Base Percentage | .350 |
| .697 | OBP Pct + SLG Pct | .788 |
| 1.5 | Ground To Fly Ball Ratio | 0.7 |
| 4.5 | Runs Created Per 27 Outs | 5.8 |
| 29.0 | Batter Rating | 39.0 |
| 0.0 | At Bats Per Home Run | 16.0 |
| 0.67 | Stolen Base Percentage | 0.00 |
| 3.78 | Pitches Per Plate Appearance | 4.18 |
| .031 | Isolated Power | .219 |
| 0.86 | Walk To Strikeout Ratio | 1.75 |
| .150 | Walks Per Plate Appearance | .175 |
| -.031 | Secondary Average Minus Batting Average | .219 |
| 8.0 | Runs Produced | 12.0 |
| 0.6 | Runs Ratio | 1.0 |
| 0.4 | Patience Ratio | 0.6 |
| 0.4 | Balls In Play Average | 0.2 |
| 80.8 | MLB Rating | 86.8 |
| 0.0 | Offensive Wins Above Replacement | 0.0 |
| 0.0 | Wins Above Replacement | 0.0 |
Game Information

Location: San Francisco, California
Attendance: 28,592 | Capacity:
2025 National League Central Standings
| TEAM | W | L | PCT | GB | STRK |
|---|---|---|---|---|---|
 Chicago Chicago |
17 | 10 | .630 | - | W3 |
 Cincinnati Cincinnati |
13 | 13 | .500 | 3.5 | W2 |
 Milwaukee Milwaukee |
13 | 14 | .481 | 4 | L3 |
 St. Louis St. Louis |
11 | 15 | .423 | 5.5 | W1 |
 Pittsburgh Pittsburgh |
11 | 16 | .407 | 6 | W1 |
2025 National League West Standings
| TEAM | W | L | PCT | GB | STRK |
|---|---|---|---|---|---|
 San Diego San Diego |
17 | 9 | .654 | - | L2 |
 San Francisco San Francisco |
17 | 10 | .630 | 0.5 | L1 |
 Los Angeles Los Angeles |
16 | 10 | .615 | 1 | L3 |
 Arizona Arizona |
14 | 12 | .538 | 3 | L3 |
 Colorado Colorado |
4 | 21 | .160 | 12.5 | L4 |