
Pittsburgh Pirates at Los Angeles Angels
· Major League Baseball
3 - 0

Cruz blasts 463-foot homer, Heaney retires first 13 batters, and Pirates shut down Angels 3-0
Heaney (2-1) struck out nine and allowed just one hit in six innings for his first win at Angel Stadium since being traded by Los Angeles in February.
Heaney struck out the first six batters he faced. He retired the side in order in the third and added two strikeouts in the fourth.
Travis d’Arnaud got the Angels' first hit in the fifth with a one-out double down the left-field line. Their second hit came with one out in the ninth before Dennis Santana earned his third save by getting Mike Trout to pop out.
Trout, who went 0 for 3 with a walk in the series opener, struck out three times for Los Angeles, which has lost seven of its last nine games.
Pittsburgh won its first road series of the season after a 9-3 victory Tuesday in the opener.
Bryan Reynolds hit a fly ball to right to drive in a run for his team-leading 13th RBI of the season.
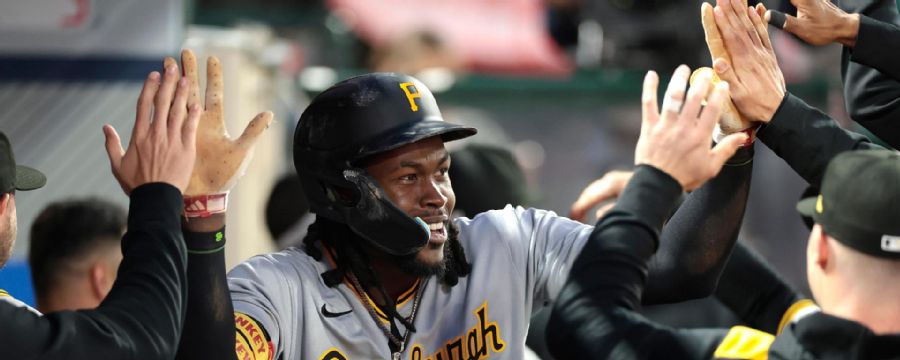
Cruz added his sixth home run of the season in the fifth — the fifth home run allowed by Jack Kochanowicz this season in 25 innings. Cruz has 12 RBI.
Kochanowicz (1-3) allowed eight hits and two earned runs in six innings.
The Angels turned three double plays and their 27 this season are the most in MLB.
How can I watch Pittsburgh Pirates vs. Los Angeles Angels?
- TV Channel: Pirates at Angels 2022 MLB Baseball, is broadcasted on MLB.TV.
- Online streaming: Sign up for Fubo.
Scoring Summary
 |
9th Inning | Trout flied out to left. |
|
9th Inning | Neto grounded out to shortstop. |
|
9th Inning | Soler doubled to left. |
|
9th Inning | Adell struck out looking. |
 |
9th Inning | Santana relieved Ferguson |
|
9th Inning | Reynolds grounded out to pitcher. |
Statistics
 PIT PIT |
 LAA LAA |
|
|---|---|---|
| 1 | Games Played | 1 |
| 1 | Team Games Played | 1 |
| 1 | Hit By Pitch | 0 |
| 16 | Ground Balls | 8 |
| 8 | Strikeouts | 12 |
| 3 | Runs Batted In | 0 |
| 0 | Sacrifice Hit | 0 |
| 11 | Hits | 2 |
| 2 | Stolen Bases | 0 |
| 2 | Walks | 0 |
| 0 | Catcher Interference | 0 |
| 3 | Runs | 0 |
| 3 | Ground Into Double Play | 0 |
| 1 | Sacrifice Flies | 0 |
| 34 | At Bats | 30 |
| 1 | Home Runs | 0 |
| 0 | Grand Slam Home Runs | 0 |
| 14 | Runners Left On Base | 7 |
| 0 | Triples | 0 |
| 1 | Game Winning RBIs | 0 |
| 0 | Intentional Walks | 0 |
| 0 | Doubles | 2 |
| 11 | Fly Balls | 10 |
| 0 | Caught Stealing | 0 |
| 136 | Pitches | 140 |
| 0 | Games Started | 0 |
| 1 | Pinch At Bats | 0 |
| 1 | Pinch Hits | 0 |
| 0.0 | Player Rating | 0.0 |
| 1 | Is Qualified | 1 |
| 1 | Is Qualified In Steals | 0 |
| 14 | Total Bases | 4 |
| 38 | Plate Appearances | 30 |
| 162.0 | Projected Home Runs | 0.0 |
| 1 | Extra Base Hits | 2 |
| 4.8 | Runs Created | -1.3 |
| .324 | Batting Average | .067 |
| 1.000 | Pinch Hit Average | .000 |
| .412 | Slugging Percentage | .133 |
| .206 | Secondary Average | .067 |
| .368 | On Base Percentage | .067 |
| .780 | OBP Pct + SLG Pct | .200 |
| 1.5 | Ground To Fly Ball Ratio | 0.8 |
| 4.8 | Runs Created Per 27 Outs | -1.3 |
| 28.0 | Batter Rating | 6.0 |
| 34.0 | At Bats Per Home Run | 0.0 |
| 1.00 | Stolen Base Percentage | 0.00 |
| 3.58 | Pitches Per Plate Appearance | 4.67 |
| .088 | Isolated Power | .067 |
| 0.25 | Walk To Strikeout Ratio | 0.00 |
| .053 | Walks Per Plate Appearance | .000 |
| -.118 | Secondary Average Minus Batting Average | .000 |
| 6.0 | Runs Produced | 0.0 |
| 1.0 | Runs Ratio | 0.0 |
| 0.5 | Patience Ratio | 0.1 |
| 0.4 | Balls In Play Average | 0.1 |
| 83.8 | MLB Rating | 55.0 |
| 0.0 | Offensive Wins Above Replacement | 0.0 |
| 0.0 | Wins Above Replacement | 0.0 |
Game Information

Location: Anaheim, California
Attendance: 31,256 | Capacity:
2025 National League Central Standings
| TEAM | W | L | PCT | GB | STRK |
|---|---|---|---|---|---|
 Chicago Chicago |
17 | 10 | .630 | - | W3 |
 Cincinnati Cincinnati |
13 | 13 | .500 | 3.5 | W2 |
 Milwaukee Milwaukee |
13 | 14 | .481 | 4 | L3 |
 St. Louis St. Louis |
11 | 15 | .423 | 5.5 | W1 |
| Pittsburgh |
11 | 16 | .407 | 6 | W1 |
2025 American League West Standings
| TEAM | W | L | PCT | GB | STRK |
|---|---|---|---|---|---|
 Texas Texas |
15 | 11 | .577 | - | W1 |
 Seattle Seattle |
14 | 12 | .538 | 1 | L1 |
 Houston Houston |
13 | 12 | .520 | 1.5 | L1 |
 Athletics Athletics |
13 | 13 | .500 | 2 | W3 |
| Los Angeles |
12 | 13 | .480 | 2.5 | L1 |