
Baltimore Orioles at Washington Nationals
· Major League Baseball
3 - 4

Garcia hits tiebreaking sacrifice fly, Wood and Bell homer as Nationals edge Orioles 4-3
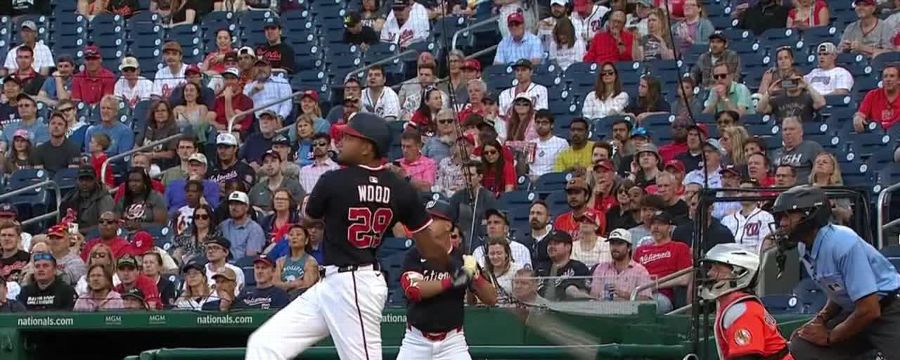
Wood drove the fifth pitch of the game by Orioles starter Tomoyaki Sugano 431 feet over the right-center field wall and Josh Bell added a two-run shot as the Nationals raced out to a 3-0 lead on three hits in the first inning.
Kyle Finnegan allowed two singles but struck out Tyler O'Neill and got Heston Kjerstad to pop out in the ninth for his ninth save of the season. Jorge Lopez (1-0) earned the win. Gregory Soto (0-1) took the loss.
Wood’s blast left the park at 116.3 mph and was second career leadoff homer. The first came against Mitch Keller on April 15 at Pittsburgh.
Bell’s homer was his fourth of the season and 27th of his career at Nationals Park.
Down 3-0, the Orioles scored single runs in the third, seventh and eighth innings. Jordan Westburg’s triple led off the eighth. Ramon Urias’s sacrifice fly to center field brought him home to tie the game at 3.
Trevor Williams skirted through trouble later in his outing, allowing one run on six hits over five innings, striking out five and walking one. He threw 99 pitches, 61 for strikes.
How can I watch Baltimore Orioles vs. Washington Nationals?
- TV Channel: Orioles at Nationals 2022 MLB Baseball, is broadcasted on MLB.TV.
- Online streaming: Sign up for Fubo.
Scoring Summary
 |
9th Inning | Kjerstad popped out to third. |
|
9th Inning | O'Neill struck out swinging. |
|
9th Inning | Mateo ran for Mountcastle |
|
9th Inning | Mountcastle singled to left, Henderson to second. |
|
9th Inning | Rutschman lined out to shortstop. |
|
9th Inning | Henderson reached on infield single to shortstop. |
Statistics
 BAL BAL |
 WSH WSH |
|
|---|---|---|
| 1 | Games Played | 1 |
| 1 | Team Games Played | 1 |
| 2 | Hit By Pitch | 0 |
| 9 | Ground Balls | 17 |
| 8 | Strikeouts | 1 |
| 3 | Runs Batted In | 4 |
| 0 | Sacrifice Hit | 0 |
| 10 | Hits | 6 |
| 1 | Stolen Bases | 0 |
| 3 | Walks | 1 |
| 0 | Catcher Interference | 0 |
| 3 | Runs | 4 |
| 0 | Ground Into Double Play | 0 |
| 2 | Sacrifice Flies | 1 |
| 35 | At Bats | 29 |
| 0 | Home Runs | 2 |
| 0 | Grand Slam Home Runs | 0 |
| 25 | Runners Left On Base | 7 |
| 1 | Triples | 0 |
| 0 | Game Winning RBIs | 1 |
| 0 | Intentional Walks | 0 |
| 0 | Doubles | 0 |
| 20 | Fly Balls | 12 |
| 0 | Caught Stealing | 0 |
| 168 | Pitches | 116 |
| 0 | Games Started | 0 |
| 0 | Pinch At Bats | 1 |
| 0 | Pinch Hits | 1 |
| 0.0 | Player Rating | 0.0 |
| 1 | Is Qualified | 1 |
| 1 | Is Qualified In Steals | 0 |
| 12 | Total Bases | 12 |
| 42 | Plate Appearances | 31 |
| 0.0 | Projected Home Runs | 324.0 |
| 1 | Extra Base Hits | 2 |
| 5.3 | Runs Created | 3.0 |
| .286 | Batting Average | .207 |
| .000 | Pinch Hit Average | 1.000 |
| .343 | Slugging Percentage | .414 |
| .171 | Secondary Average | .241 |
| .357 | On Base Percentage | .226 |
| .700 | OBP Pct + SLG Pct | .640 |
| 0.5 | Ground To Fly Ball Ratio | 1.4 |
| 5.3 | Runs Created Per 27 Outs | 3.3 |
| 25.5 | Batter Rating | 28.0 |
| 0.0 | At Bats Per Home Run | 14.5 |
| 1.00 | Stolen Base Percentage | 0.00 |
| 4.00 | Pitches Per Plate Appearance | 3.74 |
| .057 | Isolated Power | .207 |
| 0.38 | Walk To Strikeout Ratio | 1.00 |
| .071 | Walks Per Plate Appearance | .032 |
| -.114 | Secondary Average Minus Batting Average | .034 |
| 6.0 | Runs Produced | 8.0 |
| 1.0 | Runs Ratio | 1.0 |
| 0.4 | Patience Ratio | 0.4 |
| 0.4 | Balls In Play Average | 0.2 |
| 80.8 | MLB Rating | 79.5 |
| 0.0 | Offensive Wins Above Replacement | 0.0 |
| 0.0 | Wins Above Replacement | 0.0 |
Game Information

Location: Washington, District of Columbia
Attendance: 22,246 | Capacity:
2025 American League East Standings
| TEAM | W | L | PCT | GB | STRK |
|---|---|---|---|---|---|
 New York New York |
15 | 11 | .577 | - | L1 |
 Toronto Toronto |
13 | 13 | .500 | 2 | W1 |
 Boston Boston |
14 | 14 | .500 | 2 | L3 |
 Tampa Bay Tampa Bay |
12 | 14 | .462 | 3 | W3 |
| Baltimore |
10 | 14 | .417 | 4 | W1 |
2025 National League East Standings
| TEAM | W | L | PCT | GB | STRK |
|---|---|---|---|---|---|
 New York New York |
18 | 8 | .692 | - | L1 |
 Philadelphia Philadelphia |
13 | 13 | .500 | 5 | L5 |
 Miami Miami |
12 | 13 | .480 | 5.5 | W1 |
| Washington |
12 | 14 | .462 | 6 | W1 |
 Atlanta Atlanta |
11 | 14 | .440 | 6.5 | W2 |