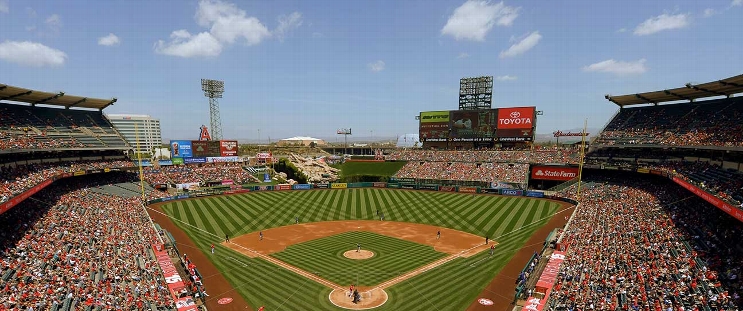
Pittsburgh Pirates at Los Angeles Angels
· Major League Baseball
9 - 3

McCutchen hits 3-run homer, Pirates get 18 hits for first time since 2023 and beat Angels 9-3

Bryan Reynolds and Isiah Kiner-Falefa each had three hits with two RBI as the Pirates won the opener of a three-game series. The 18 hits were the Pirates' most since April 19, 2023, at Colorado, according to the Elias Sports Bureau.
Pirates starter Bailey Falter left after four innings with lower back tightness.
Chase Shugart (1-0) pitched two hitless innings with three strikeouts to win his first major league decision as the Pirates improved to 9-15.
Taylor Ward homered and Jo Adell had an RBI double for the Angels, who lost for the sixth time in eight games and dropped back to .500 at 11-11.
José Soriano (2-3) allowed five runs and eight hits in 3 1/3 innings, one start after giving up a career-high 10 hits at Texas.
Pittsburgh took a 2-0 lead in the third inning on RBI singles from Joey Bart and Ke’Bryan Hayes. Ward hit his sixth home run in the bottom half and McCutchen hit his 321st homer in the bottom half for a 5-1 lead.
How can I watch Pittsburgh Pirates vs. Los Angeles Angels?
- TV Channel: Pirates at Angels 2022 MLB Baseball, is broadcasted on MLB.TV.
- Online streaming: Sign up for Fubo.
Scoring Summary
 |
9th Inning | Adell flied out to left. |
 |
9th Inning | Schanuel grounded out to second. |
 |
9th Inning | O'Hoppe struck out swinging. |
 |
9th Inning | Borucki relieved Santana |
 |
9th Inning | Triolo flied out to left. |
 |
9th Inning | McCutchen flied out to right. |
Statistics
 PIT PIT |
 LAA LAA |
|
|---|---|---|
| 1 | Games Played | 1 |
| 1 | Team Games Played | 1 |
| 0 | Hit By Pitch | 0 |
| 22 | Ground Balls | 7 |
| 6 | Strikeouts | 12 |
| 9 | Runs Batted In | 3 |
| 0 | Sacrifice Hit | 0 |
| 18 | Hits | 5 |
| 0 | Stolen Bases | 0 |
| 7 | Walks | 2 |
| 0 | Catcher Interference | 0 |
| 9 | Runs | 3 |
| 3 | Ground Into Double Play | 0 |
| 0 | Sacrifice Flies | 1 |
| 42 | At Bats | 31 |
| 1 | Home Runs | 1 |
| 0 | Grand Slam Home Runs | 0 |
| 26 | Runners Left On Base | 5 |
| 0 | Triples | 0 |
| 1 | Game Winning RBIs | 0 |
| 0 | Intentional Walks | 0 |
| 2 | Doubles | 2 |
| 14 | Fly Balls | 13 |
| 0 | Caught Stealing | 0 |
| 197 | Pitches | 136 |
| 0 | Games Started | 0 |
| 1 | Pinch At Bats | 1 |
| 1 | Pinch Hits | 0 |
| 0.0 | Player Rating | 0.0 |
| 1 | Is Qualified | 1 |
| 0 | Is Qualified In Steals | 0 |
| 23 | Total Bases | 10 |
| 49 | Plate Appearances | 34 |
| 162.0 | Projected Home Runs | 162.0 |
| 3 | Extra Base Hits | 3 |
| 10.2 | Runs Created | 2.0 |
| .429 | Batting Average | .161 |
| 1.000 | Pinch Hit Average | .000 |
| .548 | Slugging Percentage | .323 |
| .286 | Secondary Average | .226 |
| .510 | On Base Percentage | .206 |
| 1.058 | OBP Pct + SLG Pct | .528 |
| 1.6 | Ground To Fly Ball Ratio | 0.5 |
| 10.2 | Runs Created Per 27 Outs | 2.0 |
| 61.0 | Batter Rating | 24.0 |
| 42.0 | At Bats Per Home Run | 31.0 |
| 0.00 | Stolen Base Percentage | 0.00 |
| 4.02 | Pitches Per Plate Appearance | 4.00 |
| .119 | Isolated Power | .161 |
| 1.17 | Walk To Strikeout Ratio | 0.17 |
| .143 | Walks Per Plate Appearance | .059 |
| -.143 | Secondary Average Minus Batting Average | .065 |
| 18.0 | Runs Produced | 6.0 |
| 1.0 | Runs Ratio | 1.0 |
| 0.6 | Patience Ratio | 0.4 |
| 0.5 | Balls In Play Average | 0.2 |
| 112.3 | MLB Rating | 71.3 |
| 0.0 | Offensive Wins Above Replacement | 0.0 |
| 0.0 | Wins Above Replacement | 0.0 |
Game Information

Location: Anaheim, California
Attendance: 30,439 | Capacity:
2025 National League Central Standings
| TEAM | W | L | PCT | GB | STRK |
|---|---|---|---|---|---|
 Chicago Chicago |
17 | 10 | .630 | - | W3 |
 Cincinnati Cincinnati |
13 | 13 | .500 | 3.5 | W2 |
 Milwaukee Milwaukee |
13 | 14 | .481 | 4 | L3 |
 St. Louis St. Louis |
11 | 15 | .423 | 5.5 | W1 |
 Pittsburgh Pittsburgh |
11 | 16 | .407 | 6 | W1 |
2025 American League West Standings
| TEAM | W | L | PCT | GB | STRK |
|---|---|---|---|---|---|
 Texas Texas |
15 | 11 | .577 | - | W1 |
 Seattle Seattle |
14 | 12 | .538 | 1 | L1 |
 Houston Houston |
13 | 12 | .520 | 1.5 | L1 |
 Athletics Athletics |
13 | 13 | .500 | 2 | W3 |
 Los Angeles Los Angeles |
12 | 13 | .480 | 2.5 | L1 |