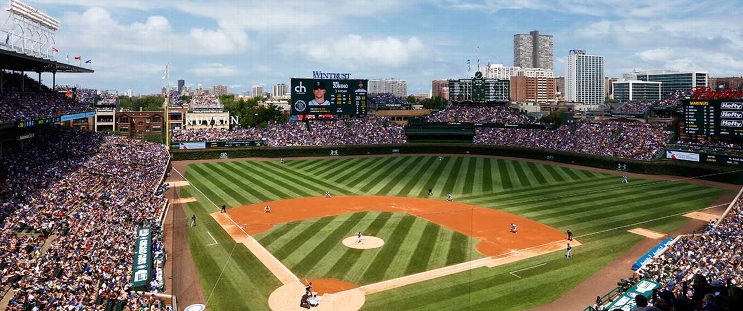
Arizona Diamondbacks at Chicago Cubs
· Major League Baseball
3 - 2

Naylor's third hit lifts Diamondbacks over Cubs 3-2 in 11 innings

Naylor grounded a single to right for his second RBI. The top of 11th ended when Naylor tried to steal home and was thrown out by reliever Jordan Wicks (0-1).
Shelby Miller (2-0) pitched two scoreless innings and for Drey Jameson tossed a 1-2-3 11th for his first save.
In a game twice delayed by rain for a total of 98 minutes, the teams exchanged runs in the 10th.
Chicago automatic runner Dansby Swanson scored from second on Nico Hoerner's single to tie it at 2. Tim Tawa came home from second in the top half when Hoerner couldn't handle reliever Wick's throw on a sacrifice bunt.
Michael Busch had an RBI. The Diamondbacks limited the Cubs, who lead the majors with 145 runs, to four hits.
Diamondbacks starter Merrill Kelly allowed one run and two over 5 2/3 innings. He left with right leg cramping after retiring 16 hitters in a row.
Corbin Carroll went 0 for 5, ending a streak of reaching base in 27 games dating to Sept. 23.
Cubs starter Jameson Taillon allowed one run and three hits in five innings.
Cubs: LHP Shota Imanaga (2-1, ERA, 2.22 ERA) starts against Dodgers RHP Dustin May (1-1, 1.06) on Tuesday in Chicago.
How can I watch Arizona Diamondbacks vs. Chicago Cubs?
- TV Channel: Diamondbacks at Cubs 2022 MLB Baseball, is broadcasted on MLB.TV.
- Online streaming: Sign up for Fubo.
Scoring Summary
 |
11th Inning | Tucker lined out to center. |
 |
11th Inning | Happ lined into double play, to shortstop, Berti doubled off second. |
 |
11th Inning | Moreno catching. |
 |
11th Inning | Jameson relieved Miller |
 |
11th Inning | Naylor caught stealing home, pitcher to catcher. |
 |
11th Inning | Moreno hit for Herrera |
Statistics
 ARI ARI |
 CHC CHC |
|
|---|---|---|
| 1 | Games Played | 1 |
| 1 | Team Games Played | 1 |
| 0 | Hit By Pitch | 0 |
| 13 | Ground Balls | 11 |
| 11 | Strikeouts | 10 |
| 2 | Runs Batted In | 2 |
| 1 | Sacrifice Hit | 0 |
| 8 | Hits | 4 |
| 2 | Stolen Bases | 2 |
| 2 | Walks | 2 |
| 0 | Catcher Interference | 0 |
| 3 | Runs | 2 |
| 0 | Ground Into Double Play | 0 |
| 0 | Sacrifice Flies | 0 |
| 40 | At Bats | 36 |
| 0 | Home Runs | 0 |
| 0 | Grand Slam Home Runs | 0 |
| 23 | Runners Left On Base | 15 |
| 0 | Triples | 0 |
| 1 | Game Winning RBIs | 0 |
| 0 | Intentional Walks | 0 |
| 2 | Doubles | 0 |
| 17 | Fly Balls | 15 |
| 1 | Caught Stealing | 0 |
| 167 | Pitches | 172 |
| 0 | Games Started | 0 |
| 2 | Pinch At Bats | 0 |
| 1 | Pinch Hits | 0 |
| 0.0 | Player Rating | 0.0 |
| 1 | Is Qualified | 1 |
| 1 | Is Qualified In Steals | 1 |
| 10 | Total Bases | 4 |
| 43 | Plate Appearances | 38 |
| 0.0 | Projected Home Runs | 0.0 |
| 2 | Extra Base Hits | 0 |
| 2.2 | Runs Created | -0.2 |
| .200 | Batting Average | .111 |
| .500 | Pinch Hit Average | .000 |
| .250 | Slugging Percentage | .111 |
| .125 | Secondary Average | .111 |
| .238 | On Base Percentage | .158 |
| .488 | OBP Pct + SLG Pct | .269 |
| 0.8 | Ground To Fly Ball Ratio | 0.7 |
| 1.7 | Runs Created Per 27 Outs | -0.2 |
| 24.0 | Batter Rating | 14.0 |
| 0.0 | At Bats Per Home Run | 0.0 |
| 0.67 | Stolen Base Percentage | 1.00 |
| 3.88 | Pitches Per Plate Appearance | 4.53 |
| .050 | Isolated Power | .000 |
| 0.18 | Walk To Strikeout Ratio | 0.20 |
| .047 | Walks Per Plate Appearance | .053 |
| -.075 | Secondary Average Minus Batting Average | .000 |
| 5.0 | Runs Produced | 4.0 |
| 0.7 | Runs Ratio | 1.0 |
| 0.3 | Patience Ratio | 0.2 |
| 0.3 | Balls In Play Average | 0.2 |
| 72.3 | MLB Rating | 61.5 |
| 0.0 | Offensive Wins Above Replacement | 0.0 |
| 0.0 | Wins Above Replacement | 0.0 |
Game Information

Location: Chicago, Illinois
Attendance: 29,062 | Capacity:
2025 National League West Standings
| TEAM | W | L | PCT | GB | STRK |
|---|---|---|---|---|---|
 San Diego San Diego |
17 | 9 | .654 | - | L2 |
 San Francisco San Francisco |
17 | 10 | .630 | 0.5 | L1 |
 Los Angeles Los Angeles |
16 | 10 | .615 | 1 | L3 |
 Arizona Arizona |
14 | 12 | .538 | 3 | L3 |
 Colorado Colorado |
4 | 21 | .160 | 12.5 | L4 |
2025 National League Central Standings
| TEAM | W | L | PCT | GB | STRK |
|---|---|---|---|---|---|
 Chicago Chicago |
17 | 10 | .630 | - | W3 |
 Cincinnati Cincinnati |
13 | 13 | .500 | 3.5 | W2 |
 Milwaukee Milwaukee |
13 | 14 | .481 | 4 | L3 |
 St. Louis St. Louis |
11 | 15 | .423 | 5.5 | W1 |
 Pittsburgh Pittsburgh |
11 | 16 | .407 | 6 | W1 |