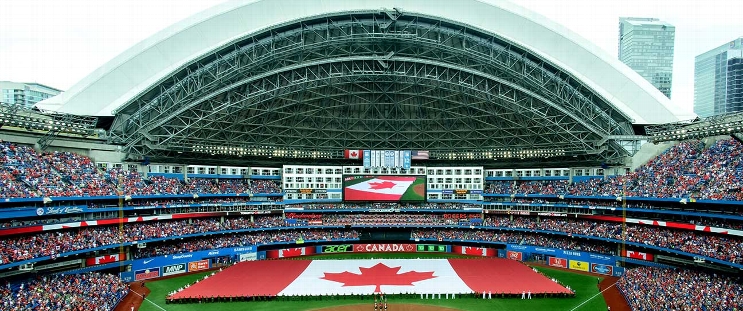
Seattle Mariners at Toronto Blue Jays
· Major League Baseball
8 - 3

Raleigh and Tellez each hit 2-run HRs, Moore adds solo blast as Mariners beat Blue Jays 8-3

Raleigh has nine home runs, tying him with Athletics first baseman Tyler Soderstrom for the major league lead.
The Mariners are 3-0 in series-deciding games.
Luis Castillo (2-2) matched a career high by allowing 10 hits in five innings but won for the first time in three starts. Castillo allowed three runs, walked two and struck out five.
Seattle needed eight pitches to take a 3-0 lead before Toronto recorded an out in the first inning. Moore homered to begin the game, his fifth, and Julio Rodríguez doubled before Raleigh connected.
In the second, Randy Arozarena had a two-run single and Mitch Garver’s base hit made it 6-0.
Blue Jays left-hander Easton Lucas (2-2) allowed six runs in 1 2/3 innings, before right-hander Paxton Schultz came on and struck out eight in 4 1/3 shutout innings, matching a major league record for strikeouts by a reliever making his debut.
Schultz was selected from Triple-A Buffalo before Sunday’s game. Toronto also recalled right-hander Dillon Tate, who gave up Tellez’s homer in the seventh.
Tellez homered against his former team in all three games of the series. His only other homer this season came April 11 against Texas.
Blue Jays: RHP Kevin Gausman (2-1, 2.49) is scheduled to start at Houston on Monday against RHP Hunter Brown (2-1, 1.50).
How can I watch Seattle Mariners vs. Toronto Blue Jays?
- TV Channel: Mariners at Blue Jays 2022 MLB Baseball, is broadcasted on MLB.TV.
- Online streaming: Sign up for Fubo.
Scoring Summary
 |
9th Inning | Straw fouled out to first. |
 |
9th Inning | Springer popped out to second. |
 |
9th Inning | Giménez lined out to center. |
 |
9th Inning | Legumina relieved Thornton |
 |
9th Inning | Tellez struck out swinging. |
 |
9th Inning | Garver popped out to second. |
Statistics
 SEA SEA |
 TOR TOR |
|
|---|---|---|
| 1 | Games Played | 1 |
| 1 | Team Games Played | 1 |
| 1 | Hit By Pitch | 1 |
| 8 | Ground Balls | 13 |
| 18 | Strikeouts | 7 |
| 8 | Runs Batted In | 3 |
| 0 | Sacrifice Hit | 0 |
| 12 | Hits | 11 |
| 0 | Stolen Bases | 0 |
| 2 | Walks | 4 |
| 0 | Catcher Interference | 0 |
| 8 | Runs | 3 |
| 0 | Ground Into Double Play | 1 |
| 0 | Sacrifice Flies | 1 |
| 39 | At Bats | 36 |
| 3 | Home Runs | 0 |
| 0 | Grand Slam Home Runs | 0 |
| 21 | Runners Left On Base | 31 |
| 0 | Triples | 0 |
| 1 | Game Winning RBIs | 0 |
| 0 | Intentional Walks | 0 |
| 1 | Doubles | 4 |
| 13 | Fly Balls | 17 |
| 1 | Caught Stealing | 0 |
| 173 | Pitches | 146 |
| 0 | Games Started | 0 |
| 1 | Pinch At Bats | 2 |
| 1 | Pinch Hits | 0 |
| 0.0 | Player Rating | 0.0 |
| 1 | Is Qualified | 1 |
| 1 | Is Qualified In Steals | 0 |
| 22 | Total Bases | 15 |
| 42 | Plate Appearances | 42 |
| 486.0 | Projected Home Runs | 0.0 |
| 4 | Extra Base Hits | 4 |
| 7.2 | Runs Created | 5.9 |
| .308 | Batting Average | .306 |
| 1.000 | Pinch Hit Average | .000 |
| .564 | Slugging Percentage | .417 |
| .282 | Secondary Average | .222 |
| .357 | On Base Percentage | .381 |
| .921 | OBP Pct + SLG Pct | .798 |
| 0.6 | Ground To Fly Ball Ratio | 0.8 |
| 7.0 | Runs Created Per 27 Outs | 5.9 |
| 55.0 | Batter Rating | 31.0 |
| 13.0 | At Bats Per Home Run | 0.0 |
| 0.00 | Stolen Base Percentage | 0.00 |
| 4.12 | Pitches Per Plate Appearance | 3.48 |
| .256 | Isolated Power | .111 |
| 0.11 | Walk To Strikeout Ratio | 0.57 |
| .048 | Walks Per Plate Appearance | .095 |
| -.026 | Secondary Average Minus Batting Average | -.083 |
| 16.0 | Runs Produced | 6.0 |
| 1.0 | Runs Ratio | 1.0 |
| 0.6 | Patience Ratio | 0.5 |
| 0.5 | Balls In Play Average | 0.4 |
| 98.3 | MLB Rating | 84.5 |
| 0.0 | Offensive Wins Above Replacement | 0.0 |
| 0.0 | Wins Above Replacement | 0.0 |
Game Information

Location: Toronto, Ontario
Attendance: 25,752 | Capacity:
2025 American League West Standings
| TEAM | W | L | PCT | GB | STRK |
|---|---|---|---|---|---|
 Texas Texas |
15 | 11 | .577 | - | W1 |
 Seattle Seattle |
14 | 12 | .538 | 1 | L1 |
 Houston Houston |
13 | 12 | .520 | 1.5 | L1 |
 Athletics Athletics |
13 | 13 | .500 | 2 | W3 |
 Los Angeles Los Angeles |
12 | 13 | .480 | 2.5 | L1 |
2025 American League East Standings
| TEAM | W | L | PCT | GB | STRK |
|---|---|---|---|---|---|
 New York New York |
15 | 11 | .577 | - | L1 |
 Boston Boston |
14 | 13 | .519 | 1.5 | L2 |
 Toronto Toronto |
13 | 13 | .500 | 2 | W1 |
 Tampa Bay Tampa Bay |
12 | 14 | .462 | 3 | W3 |
 Baltimore Baltimore |
10 | 14 | .417 | 4 | W1 |