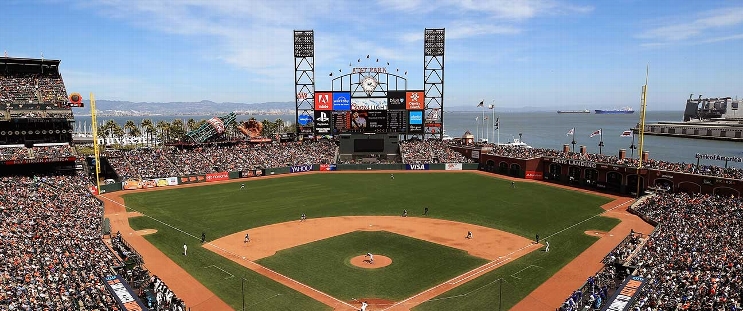
Cincinnati Reds at San Francisco Giants
· Major League Baseball
6 - 8

Yastrzemski hits a 2-run homer in the 10th inning and Giants top Reds 8-6

Wilmer Flores had three hits including a home run for San Francisco, which avoided a three-game series sweep.
Yastrzemski homered off Emilio Pagán (0-1) with automatic runner Matt Chapman at third.
Elly De La Cruz had a two-run double and Gavin Lux singled in two for Cincinnati in a five-run third inning.
The Giants trailed 6-1 in the sixth when Patrick Bailey tripled in a run during a four-run inning. Flores homered leading off the eighth to tie it.
Giants starter Justin Verlander struck out nine and gave up six runs (five earned) on five hits and three walks in 5 2/3 innings. The 42-year-old, who signed a $15 million one-year contract in January, was coming off a forgettable home debut on Friday against Seattle in which he lasted just 2 1/3 innings.
Erik Miller (1-0) pitched a perfect 10th inning for the win.
Reds starter Nick Martinez struck out eight and gave up four runs on seven hits and a walk in 5 2/3 innings.
Giants: LHP Robbie Ray (2-0, 3.18) is scheduled to pitch against the Yankees in New York on Friday night opposite RHP Marcus Stroman (0-0, 7.27).
How can I watch Cincinnati Reds vs. San Francisco Giants?
- TV Channel: Reds at Giants 2022 MLB Baseball, is broadcasted on MLB.TV.
- Online streaming: Sign up for Fubo.
Scoring Summary
 |
10th Inning | Yastrzemski homered to right (381 feet), Chapman scored. |
 |
10th Inning | Ramos flied out to right, Chapman to third. |
 |
10th Inning | Pagán relieved Gibaut |
 |
10th Inning | Marte at third base. |
 |
10th Inning | Encarnacion-Strand flied out to right. |
 |
10th Inning | Lux flied out to center, Marte to third. |
Statistics
 CIN CIN |
 SF SF |
|
|---|---|---|
| 1 | Games Played | 1 |
| 1 | Team Games Played | 1 |
| 0 | Hit By Pitch | 0 |
| 11 | Ground Balls | 9 |
| 16 | Strikeouts | 8 |
| 6 | Runs Batted In | 7 |
| 0 | Sacrifice Hit | 0 |
| 6 | Hits | 12 |
| 0 | Stolen Bases | 0 |
| 4 | Walks | 1 |
| 0 | Catcher Interference | 0 |
| 6 | Runs | 8 |
| 0 | Ground Into Double Play | 0 |
| 0 | Sacrifice Flies | 0 |
| 37 | At Bats | 41 |
| 0 | Home Runs | 2 |
| 0 | Grand Slam Home Runs | 0 |
| 13 | Runners Left On Base | 19 |
| 0 | Triples | 2 |
| 0 | Game Winning RBIs | 1 |
| 0 | Intentional Walks | 0 |
| 2 | Doubles | 4 |
| 10 | Fly Balls | 24 |
| 0 | Caught Stealing | 0 |
| 146 | Pitches | 136 |
| 0 | Games Started | 0 |
| 1 | Pinch At Bats | 1 |
| 0 | Pinch Hits | 0 |
| 0.0 | Player Rating | 0.0 |
| 1 | Is Qualified | 1 |
| 0 | Is Qualified In Steals | 0 |
| 8 | Total Bases | 26 |
| 41 | Plate Appearances | 42 |
| 0.0 | Projected Home Runs | 324.0 |
| 2 | Extra Base Hits | 8 |
| 1.7 | Runs Created | 8.0 |
| .162 | Batting Average | .293 |
| .000 | Pinch Hit Average | .000 |
| .216 | Slugging Percentage | .634 |
| .162 | Secondary Average | .366 |
| .244 | On Base Percentage | .310 |
| .460 | OBP Pct + SLG Pct | .944 |
| 1.1 | Ground To Fly Ball Ratio | 0.4 |
| 1.5 | Runs Created Per 27 Outs | 7.4 |
| 34.0 | Batter Rating | 61.0 |
| 0.0 | At Bats Per Home Run | 20.5 |
| 0.00 | Stolen Base Percentage | 0.00 |
| 3.56 | Pitches Per Plate Appearance | 3.24 |
| .054 | Isolated Power | .341 |
| 0.25 | Walk To Strikeout Ratio | 0.13 |
| .098 | Walks Per Plate Appearance | .024 |
| .000 | Secondary Average Minus Batting Average | .073 |
| 12.0 | Runs Produced | 15.0 |
| 1.0 | Runs Ratio | 0.9 |
| 0.3 | Patience Ratio | 0.7 |
| 0.3 | Balls In Play Average | 0.3 |
| 74.3 | MLB Rating | 103.0 |
| 0.0 | Offensive Wins Above Replacement | 0.0 |
| 0.0 | Wins Above Replacement | 0.0 |
Game Information

Location: San Francisco, California
Attendance: 35,186 | Capacity:
2025 National League Central Standings
| TEAM | W | L | PCT | GB | STRK |
|---|---|---|---|---|---|
 Chicago Chicago |
13 | 9 | .591 | - | W1 |
 Milwaukee Milwaukee |
11 | 9 | .550 | 1 | W3 |
 Cincinnati Cincinnati |
10 | 10 | .500 | 2 | W1 |
 St. Louis St. Louis |
9 | 11 | .450 | 3 | L2 |
 Pittsburgh Pittsburgh |
8 | 13 | .381 | 4.5 | L1 |
2025 National League West Standings
| TEAM | W | L | PCT | GB | STRK |
|---|---|---|---|---|---|
 San Diego San Diego |
15 | 5 | .750 | - | L1 |
 Los Angeles Los Angeles |
15 | 6 | .714 | 0.5 | W4 |
 San Francisco San Francisco |
13 | 7 | .650 | 2 | L2 |
 Arizona Arizona |
12 | 8 | .600 | 3 | L1 |
 Colorado Colorado |
3 | 15 | .167 | 11 | L6 |