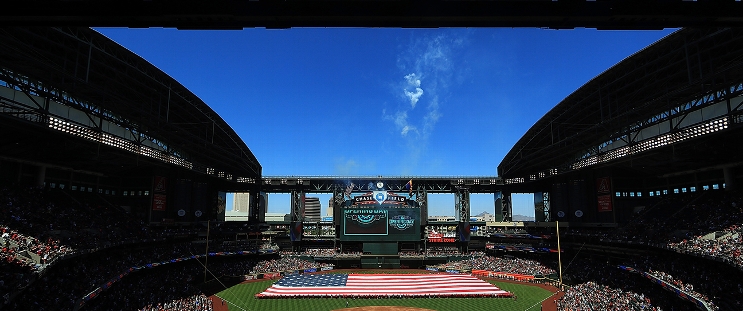
Baltimore Orioles at Arizona Diamondbacks
· Major League Baseball
0 - 9

Carroll homers again, Pfaadt throws 6 scoreless innings to lead the D-backs past the Orioles 9-0

Brandon Pfaadt (2-1) threw six scoreless innings, giving up four hits and two walks while striking out three. The D-backs won two of three games in the series.
Arizona broke the game open with a five-run fifth inning to take a 7-0 lead. Smith started the scoring with his two-run homer that landed in the Chase Field swimming pool and then Josh Naylor added a solo blast, which was his first of the season and first with the D-backs.
With two outs, Alek Thomas was hit by a pitch, Jake McCarthy doubled and rookie Tim Tawa brought them both home with a line drive single to left.
Baltimore's Dean Kremer (1-2) gave up six runs on eight hits and a walk over 4 2/3 innings. He struck out four.
Carroll made it 2-0 in the third with his solo homer that cleared the right-center field fence, just to the right of the 413-foot sign.
Carroll — the 2023 NL Rookie of the Year — has five homers through 13 games this season. Perdomo added a solo homer in the eighth that made it 8-0, capping a 3-for-4 day at the plate.
Baltimore managed just four hits — all singles.
The D-backs are off Thursday before hosting a three-game series against the Milwaukee Brewers starting Friday. Arizona LHP Eduardo Rodriguez (0-1, 6.10 ERA) will start the opener.
How can I watch Baltimore Orioles vs. Arizona Diamondbacks?
- TV Channel: Orioles at Diamondbacks 2022 MLB Baseball, is broadcasted on MLB.TV.
- Online streaming: Sign up for Fubo.
Scoring Summary
 |
9th Inning | O'Hearn grounded out to first. |
 |
9th Inning | Rutschman lined out to left. |
 |
9th Inning | Henderson grounded out to second. |
 |
9th Inning | Jarvis relieved Beeks |
 |
8th Inning | Suárez struck out swinging. |
 |
8th Inning | Naylor singled to left, Smith scored. |
Statistics
 BAL BAL |
 ARI ARI |
|
|---|---|---|
| 1 | Games Played | 1 |
| 1 | Team Games Played | 1 |
| 0 | Hit By Pitch | 1 |
| 14 | Ground Balls | 12 |
| 3 | Strikeouts | 8 |
| 0 | Runs Batted In | 9 |
| 0 | Sacrifice Hit | 0 |
| 4 | Hits | 14 |
| 0 | Stolen Bases | 0 |
| 2 | Walks | 3 |
| 0 | Catcher Interference | 0 |
| 0 | Runs | 9 |
| 2 | Ground Into Double Play | 1 |
| 0 | Sacrifice Flies | 1 |
| 28 | At Bats | 36 |
| 0 | Home Runs | 4 |
| 0 | Grand Slam Home Runs | 0 |
| 9 | Runners Left On Base | 18 |
| 0 | Triples | 0 |
| 0 | Game Winning RBIs | 1 |
| 0 | Intentional Walks | 0 |
| 0 | Doubles | 3 |
| 11 | Fly Balls | 17 |
| 0 | Caught Stealing | 0 |
| 128 | Pitches | 156 |
| 0 | Games Started | 0 |
| 0 | Pinch At Bats | 0 |
| 0 | Pinch Hits | 0 |
| 0.0 | Player Rating | 0.0 |
| 1 | Is Qualified | 1 |
| 0 | Is Qualified In Steals | 0 |
| 4 | Total Bases | 29 |
| 30 | Plate Appearances | 41 |
| 0.0 | Projected Home Runs | 648.0 |
| 0 | Extra Base Hits | 7 |
| -0.4 | Runs Created | 11.1 |
| .143 | Batting Average | .389 |
| .000 | Pinch Hit Average | .000 |
| .143 | Slugging Percentage | .806 |
| .071 | Secondary Average | .500 |
| .200 | On Base Percentage | .439 |
| .343 | OBP Pct + SLG Pct | 1.245 |
| 1.3 | Ground To Fly Ball Ratio | 0.7 |
| -0.4 | Runs Created Per 27 Outs | 12.4 |
| 4.0 | Batter Rating | 68.0 |
| 0.0 | At Bats Per Home Run | 9.0 |
| 0.00 | Stolen Base Percentage | 0.00 |
| 4.27 | Pitches Per Plate Appearance | 3.80 |
| .000 | Isolated Power | .417 |
| 0.67 | Walk To Strikeout Ratio | 0.38 |
| .067 | Walks Per Plate Appearance | .073 |
| -.071 | Secondary Average Minus Batting Average | .111 |
| 0.0 | Runs Produced | 18.0 |
| 0.0 | Runs Ratio | 1.0 |
| 0.2 | Patience Ratio | 0.9 |
| 0.2 | Balls In Play Average | 0.4 |
| 60.8 | MLB Rating | 113.8 |
| 0.0 | Offensive Wins Above Replacement | 0.0 |
| 0.0 | Wins Above Replacement | 0.0 |
Game Information

Location: Phoenix, Arizona
Attendance: 22,411 | Capacity:
2025 American League East Standings
| TEAM | W | L | PCT | GB | STRK |
|---|---|---|---|---|---|
 New York New York |
13 | 7 | .650 | - | W5 |
 Toronto Toronto |
12 | 8 | .600 | 1 | W3 |
 Boston Boston |
11 | 10 | .524 | 2.5 | W3 |
 Baltimore Baltimore |
8 | 11 | .421 | 4.5 | L1 |
 Tampa Bay Tampa Bay |
8 | 12 | .400 | 5 | L4 |
2025 National League West Standings
| TEAM | W | L | PCT | GB | STRK |
|---|---|---|---|---|---|
 San Diego San Diego |
15 | 5 | .750 | - | L1 |
 Los Angeles Los Angeles |
15 | 6 | .714 | 0.5 | W4 |
 San Francisco San Francisco |
13 | 7 | .650 | 2 | L2 |
 Arizona Arizona |
12 | 8 | .600 | 3 | L1 |
 Colorado Colorado |
3 | 15 | .167 | 11 | L6 |