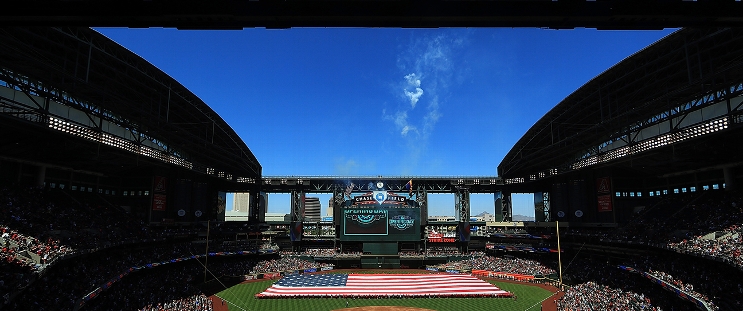
Baltimore Orioles at Arizona Diamondbacks
· Major League Baseball
3 - 4

Merrill Kelly pitches into the 7th inning as the Diamondbacks beat the Orioles 4-3

Carroll hit a solo homer off Charlie Morton (0-3) and Josh Naylor added a two-run double to help the Diamondbacks end a three-game losing streak.
Kelly (2-1) allowed three runs and four hits. Justin Martinez worked around a hit batter in the ninth for his second save.
Coming off a shaky start against the Yankees, Kelly gave up Cedric Mullins' two-run single in the first inning. The right-hander settled in after that, retiring 12 straight hitters before third baseman Eugenio Suárez's error with two outs in the fifth inning.
Kelly was ejected after being lifted in the seventh for arguing a check swing call, leading to the ejection of Arizona manager Torey Lovullo.
Morton gave up a run in the first inning after walking two and hitting a batter. Carroll hit his fourth homer of the season in the third, and Naylor lined a two-run double to put Arizona up 4-2 in the fifth.
Morton has allowed at least four runs in each of his first three starts after giving up four runs on four hits in five innings. He walked five and struck out four.
How can I watch Baltimore Orioles vs. Arizona Diamondbacks?
- TV Channel: Orioles at Diamondbacks 2022 MLB Baseball, is broadcasted on MLB.com.
- Online streaming: Sign up for Fubo.
Scoring Summary
 |
9th Inning | Kjerstad grounded into double play, shortstop to second to first, O'Neill out at second. |
 |
9th Inning | O'Neill hit by pitch. |
 |
9th Inning | Mullins struck out looking. |
 |
9th Inning | Martinez relieved Puk |
 |
8th Inning | Moreno lined into double play, to second, Naylor doubled off second. |
 |
8th Inning | Suárez walked. |
Statistics
 BAL BAL |
 ARI ARI |
|
|---|---|---|
| 1 | Games Played | 1 |
| 1 | Team Games Played | 1 |
| 3 | Hit By Pitch | 1 |
| 12 | Ground Balls | 12 |
| 6 | Strikeouts | 5 |
| 2 | Runs Batted In | 3 |
| 0 | Sacrifice Hit | 0 |
| 4 | Hits | 5 |
| 2 | Stolen Bases | 0 |
| 2 | Walks | 7 |
| 0 | Catcher Interference | 0 |
| 3 | Runs | 4 |
| 2 | Ground Into Double Play | 2 |
| 0 | Sacrifice Flies | 0 |
| 29 | At Bats | 26 |
| 0 | Home Runs | 1 |
| 0 | Grand Slam Home Runs | 0 |
| 10 | Runners Left On Base | 18 |
| 0 | Triples | 0 |
| 0 | Game Winning RBIs | 1 |
| 0 | Intentional Walks | 0 |
| 1 | Doubles | 2 |
| 11 | Fly Balls | 9 |
| 0 | Caught Stealing | 0 |
| 123 | Pitches | 122 |
| 0 | Games Started | 0 |
| 1 | Pinch At Bats | 1 |
| 0 | Pinch Hits | 0 |
| 0.0 | Player Rating | 0.0 |
| 1 | Is Qualified | 1 |
| 1 | Is Qualified In Steals | 0 |
| 5 | Total Bases | 10 |
| 34 | Plate Appearances | 34 |
| 0.0 | Projected Home Runs | 162.0 |
| 1 | Extra Base Hits | 3 |
| 1.1 | Runs Created | 3.9 |
| .138 | Batting Average | .192 |
| .000 | Pinch Hit Average | .000 |
| .172 | Slugging Percentage | .385 |
| .172 | Secondary Average | .462 |
| .265 | On Base Percentage | .382 |
| .437 | OBP Pct + SLG Pct | .767 |
| 1.1 | Ground To Fly Ball Ratio | 1.3 |
| 1.1 | Runs Created Per 27 Outs | 4.6 |
| 18.0 | Batter Rating | 26.0 |
| 0.0 | At Bats Per Home Run | 26.0 |
| 1.00 | Stolen Base Percentage | 0.00 |
| 3.62 | Pitches Per Plate Appearance | 3.59 |
| .034 | Isolated Power | .192 |
| 0.33 | Walk To Strikeout Ratio | 1.40 |
| .059 | Walks Per Plate Appearance | .206 |
| .034 | Secondary Average Minus Batting Average | .269 |
| 5.0 | Runs Produced | 7.0 |
| 0.7 | Runs Ratio | 0.8 |
| 0.3 | Patience Ratio | 0.6 |
| 0.2 | Balls In Play Average | 0.2 |
| 67.0 | MLB Rating | 76.5 |
| 0.0 | Offensive Wins Above Replacement | 0.0 |
| 0.0 | Wins Above Replacement | 0.0 |
Game Information

Location: Phoenix, Arizona
Attendance: 23,843 | Capacity:
2025 American League East Standings
| TEAM | W | L | PCT | GB | STRK |
|---|---|---|---|---|---|
 New York New York |
12 | 7 | .632 | - | W4 |
 Toronto Toronto |
11 | 8 | .579 | 1 | W2 |
 Boston Boston |
10 | 10 | .500 | 2.5 | W2 |
 Baltimore Baltimore |
8 | 10 | .444 | 3.5 | W2 |
 Tampa Bay Tampa Bay |
8 | 11 | .421 | 4 | L3 |
2025 National League West Standings
| TEAM | W | L | PCT | GB | STRK |
|---|---|---|---|---|---|
 San Diego San Diego |
15 | 4 | .789 | - | W1 |
 Los Angeles Los Angeles |
14 | 6 | .700 | 1.5 | W3 |
 San Francisco San Francisco |
13 | 6 | .684 | 2 | L1 |
 Arizona Arizona |
12 | 8 | .600 | 3.5 | L1 |
 Colorado Colorado |
3 | 15 | .167 | 11.5 | L6 |