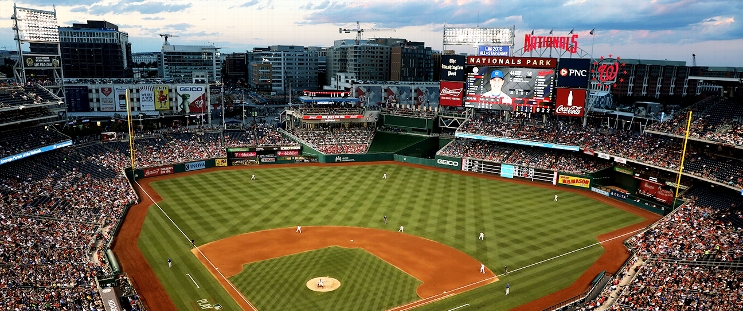
Arizona Diamondbacks at Washington Nationals
· Major League Baseball
4 - 5

Nationals beat Arizona 5-4, deal Corbin Burnes his first loss as Diamondbacks ace

Washington took two of three from Arizona, winning a series from the Diamondbacks for the first time since 2021. It was the Nationals’ first home series victory over Arizona since 2017.
Burnes (0-1) yielded four runs while throwing 89 pitches over five innings in his second start since signing a six-year, $210 million deal in December. He gave up Nathaniel Lowe’s RBI double and Call’s run-scoring single the first inning, CJ Abrams’ sacrifice fly in the second and Dejong’s two-out RBI double in the third as his ERA rose to 5.79.
Williams (1-0) allowed three runs and has pitched at least five innings in 14 of his 15 starts since joining the Nationals before last season.
Kyle Finnegan worked the ninth for his third save in as many attempts.
Jose Herrera homered in the second inning for Arizona, his second in 134 career games.
LHP MacKenzie Gore (0-1, 2.45) makes his third start of the season as Washington welcomes the Los Angeles Dodgers for the opener of a three-game series Monday.
How can I watch Arizona Diamondbacks vs. Washington Nationals?
- TV Channel: Diamondbacks at Nationals 2022 MLB Baseball, is broadcasted on MLB.TV.
- Online streaming: Sign up for Fubo.
Scoring Summary
 |
9th Inning | Grichuk grounded out to shortstop. |
 |
9th Inning | Perdomo grounded out to first, Carroll to third. |
 |
9th Inning | Carroll doubled to center. |
 |
9th Inning | Tawa struck out swinging. |
 |
9th Inning | Finnegan relieved López |
 |
9th Inning | Tawa hit for Hampson |
Statistics
 ARI ARI |
 WSH WSH |
|
|---|---|---|
| 1 | Games Played | 1 |
| 1 | Team Games Played | 1 |
| 0 | Hit By Pitch | 2 |
| 12 | Ground Balls | 12 |
| 11 | Strikeouts | 7 |
| 4 | Runs Batted In | 5 |
| 1 | Sacrifice Hit | 1 |
| 9 | Hits | 9 |
| 1 | Stolen Bases | 1 |
| 3 | Walks | 5 |
| 0 | Catcher Interference | 0 |
| 4 | Runs | 5 |
| 0 | Ground Into Double Play | 0 |
| 1 | Sacrifice Flies | 1 |
| 34 | At Bats | 29 |
| 1 | Home Runs | 0 |
| 0 | Grand Slam Home Runs | 0 |
| 14 | Runners Left On Base | 16 |
| 2 | Triples | 0 |
| 0 | Game Winning RBIs | 1 |
| 0 | Intentional Walks | 0 |
| 1 | Doubles | 3 |
| 13 | Fly Balls | 12 |
| 0 | Caught Stealing | 0 |
| 174 | Pitches | 137 |
| 0 | Games Started | 0 |
| 3 | Pinch At Bats | 0 |
| 0 | Pinch Hits | 0 |
| 0.0 | Player Rating | 0.0 |
| 1 | Is Qualified | 1 |
| 1 | Is Qualified In Steals | 1 |
| 17 | Total Bases | 12 |
| 39 | Plate Appearances | 38 |
| 162.0 | Projected Home Runs | 0.0 |
| 4 | Extra Base Hits | 3 |
| 5.9 | Runs Created | 6.3 |
| .265 | Batting Average | .310 |
| .000 | Pinch Hit Average | .000 |
| .500 | Slugging Percentage | .414 |
| .353 | Secondary Average | .310 |
| .316 | On Base Percentage | .432 |
| .816 | OBP Pct + SLG Pct | .846 |
| 0.9 | Ground To Fly Ball Ratio | 1.0 |
| 5.9 | Runs Created Per 27 Outs | 7.8 |
| 36.0 | Batter Rating | 36.0 |
| 34.0 | At Bats Per Home Run | 0.0 |
| 1.00 | Stolen Base Percentage | 1.00 |
| 4.46 | Pitches Per Plate Appearance | 3.61 |
| .235 | Isolated Power | .103 |
| 0.27 | Walk To Strikeout Ratio | 0.71 |
| .077 | Walks Per Plate Appearance | .132 |
| .088 | Secondary Average Minus Batting Average | .000 |
| 8.0 | Runs Produced | 10.0 |
| 1.0 | Runs Ratio | 1.0 |
| 0.6 | Patience Ratio | 0.5 |
| 0.4 | Balls In Play Average | 0.4 |
| 85.5 | MLB Rating | 85.8 |
| 0.0 | Offensive Wins Above Replacement | 0.0 |
| 0.0 | Wins Above Replacement | 0.0 |
Game Information

Location: Washington, District of Columbia
Attendance: 14,528 | Capacity:
2025 National League West Standings
| TEAM | W | L | PCT | GB | STRK |
|---|---|---|---|---|---|
 San Diego San Diego |
9 | 2 | .818 | - | W2 |
 San Francisco San Francisco |
8 | 2 | .800 | 0.5 | L1 |
 Los Angeles Los Angeles |
9 | 3 | .750 | 0.5 | L2 |
 Arizona Arizona |
5 | 6 | .455 | 4 | L3 |
 Colorado Colorado |
2 | 7 | .222 | 6 | W1 |
2025 National League East Standings
| TEAM | W | L | PCT | GB | STRK |
|---|---|---|---|---|---|
 Philadelphia Philadelphia |
7 | 2 | .778 | - | W1 |
 New York New York |
7 | 3 | .700 | 0.5 | W5 |
 Miami Miami |
5 | 5 | .500 | 2.5 | L1 |
 Washington Washington |
4 | 6 | .400 | 3.5 | W3 |
 Atlanta Atlanta |
1 | 8 | .111 | 6 | L1 |