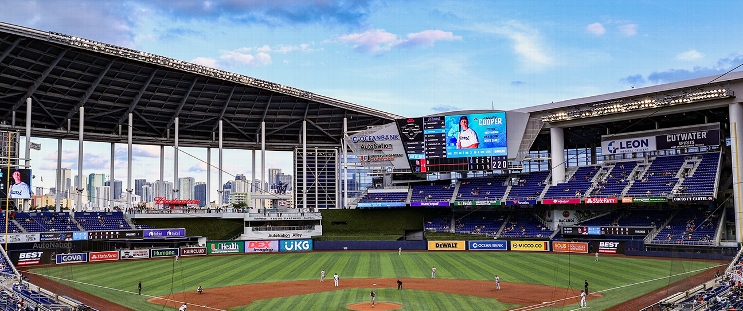
New York Mets at Miami Marlins
· Major League Baseball
6 - 5

Alonso hits tying homer and Mets edge Marlins 6-5 in 11 innings

Alonso also doubled twice and finished with four RBI. All three of his hits came off the bat at 113 mph or more.
Juan Soto scored three times for the Mets, who used eight pitchers and took two of three in the series to finish 3-3 on their season-opening trip. They play their home opener Friday against Toronto.
Alonso drew a leadoff walk from Xzavion Curry (0-1) in the 11th, and Brandon Nimmo's single loaded the bases with nobody out. Jesse Winker walked to give the Mets a 5-4 lead, and Alonso scored on an error by shortstop Xavier Edwards.
José Buttó (1-0) threw two perfect innings on just 15 pitches. Huascar Brazobán, traded from the Marlins to the Mets last July, entered with two on to protect a 6-5 lead and got two outs for his first save in 119 major league appearances.
Edwards had four hits for Miami, including an RBI single off Danny Young to start the bottom of the 11th. Griffin Conine added three hits.
Miami visits Atlanta on Friday. Spencer Schwellenbach (0-0) pitches for the Braves, but the Marlins hadn't announced a scheduled starter.
How can I watch New York Mets vs. Miami Marlins?
- TV Channel: Mets at Marlins 2022 MLB Baseball, is broadcasted on MLB.TV.
- Online streaming: Sign up for Fubo.
Scoring Summary
 |
11th Inning | Lopez struck out looking. |
 |
11th Inning | Bride flied out to right, Edwards to third. |
 |
11th Inning | Brazobán relieved Young |
 |
11th Inning | Conine struck out swinging. |
 |
11th Inning | Stowers walked, Edwards to second. |
 |
11th Inning | Edwards singled to left, Sanoja scored. |
Statistics
 NYM NYM |
 MIA MIA |
|
|---|---|---|
| 1 | Games Played | 1 |
| 1 | Team Games Played | 1 |
| 0 | Hit By Pitch | 0 |
| 15 | Ground Balls | 23 |
| 9 | Strikeouts | 11 |
| 5 | Runs Batted In | 4 |
| 0 | Sacrifice Hit | 1 |
| 9 | Hits | 13 |
| 0 | Stolen Bases | 1 |
| 3 | Walks | 4 |
| 0 | Catcher Interference | 0 |
| 6 | Runs | 5 |
| 2 | Ground Into Double Play | 0 |
| 0 | Sacrifice Flies | 1 |
| 41 | At Bats | 44 |
| 1 | Home Runs | 0 |
| 0 | Grand Slam Home Runs | 0 |
| 23 | Runners Left On Base | 29 |
| 0 | Triples | 0 |
| 1 | Game Winning RBIs | 0 |
| 0 | Intentional Walks | 0 |
| 3 | Doubles | 1 |
| 17 | Fly Balls | 12 |
| 0 | Caught Stealing | 1 |
| 175 | Pitches | 175 |
| 0 | Games Started | 0 |
| 1 | Pinch At Bats | 1 |
| 1 | Pinch Hits | 0 |
| 0.0 | Player Rating | 0.0 |
| 1 | Is Qualified | 1 |
| 0 | Is Qualified In Steals | 1 |
| 15 | Total Bases | 14 |
| 44 | Plate Appearances | 50 |
| 162.0 | Projected Home Runs | 0.0 |
| 4 | Extra Base Hits | 1 |
| 3.5 | Runs Created | 5.3 |
| .220 | Batting Average | .295 |
| 1.000 | Pinch Hit Average | .000 |
| .366 | Slugging Percentage | .318 |
| .220 | Secondary Average | .114 |
| .273 | On Base Percentage | .347 |
| .639 | OBP Pct + SLG Pct | .665 |
| 0.9 | Ground To Fly Ball Ratio | 1.9 |
| 2.7 | Runs Created Per 27 Outs | 4.2 |
| 40.0 | Batter Rating | 34.0 |
| 41.0 | At Bats Per Home Run | 0.0 |
| 0.00 | Stolen Base Percentage | 0.50 |
| 3.98 | Pitches Per Plate Appearance | 3.50 |
| .146 | Isolated Power | .023 |
| 0.33 | Walk To Strikeout Ratio | 0.36 |
| .068 | Walks Per Plate Appearance | .080 |
| .000 | Secondary Average Minus Batting Average | -.182 |
| 11.0 | Runs Produced | 9.0 |
| 0.8 | Runs Ratio | 0.8 |
| 0.4 | Patience Ratio | 0.4 |
| 0.3 | Balls In Play Average | 0.4 |
| 84.5 | MLB Rating | 86.0 |
| 0.0 | Offensive Wins Above Replacement | 0.0 |
| 0.0 | Wins Above Replacement | 0.0 |
Game Information

Location: Miami, Florida
Attendance: 10,598 | Capacity:
2025 National League East Standings
| TEAM | W | L | PCT | GB | STRK |
|---|---|---|---|---|---|
 Philadelphia Philadelphia |
5 | 1 | .833 | - | W3 |
 Miami Miami |
4 | 3 | .571 | 1.5 | L1 |
 New York New York |
3 | 3 | .500 | 2 | W1 |
 Washington Washington |
1 | 5 | .167 | 4 | L3 |
 Atlanta Atlanta |
0 | 7 | .000 | 5.5 | L7 |