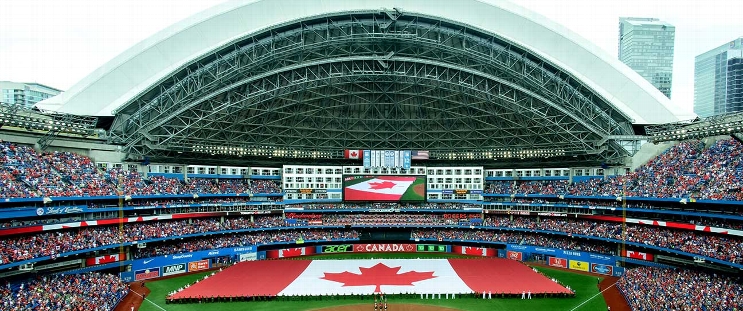
Kansas City Royals at Toronto Blue Jays
· Major League Baseball
4 - 1

Massey hits 2-run HR, Ragans fans 9 as Royals snap 3-game losing streak, beat Blue Jays 4-1
Ragans was “electric” in improving to 2-0 in three career starts against Toronto, Royals manager Matt Quatraro said.
“He had the best stuff he’s had all year,” Quatraro said. “He was locating. Early in the game he got quick outs.”
Bobby Witt Jr. reached base three times and drove in a run as the Royals improved to 17-11 in April and 18-13 overall. It’s the most victories Kansas City has had in a month since going 17-9 in June 2017.
“We’re in a good spot but nobody goes to the playoffs in April,” Massey said. “We’ve got to keep going.”
Ragans (2-2) allowed one run and four hits. The left-hander left because of cramping in his left calf after walking consecutive batters.
“We’ve got to get some fluids in him and get rid of that,” Quatraro said. “It’s the deepest he’s gone, the most pitches he’s thrown. It’s just fatigue, probably.”
John Schreiber came on and retired Cavan Biggio to end the inning.
Schreiber got four outs and right-hander James McArthur finished for his seventh save in eight chances.
Blue Jays right-hander José Berríos (4-2) allowed two runs and five hits in seven innings but lost to Ragans for the second straight outing. Ragans got the win as the Royals won a rain-shortened game in Kansas City last Thursday.
Berríos leads the majors with 43 2/3 innings and has six quality starts in seven outings.
“I’ve been feeling healthy, strong, mentally, really stronger and more mature,” Berríos said. “I want to keep building on top of this.”
Massey struck out to end Monday’s 6-5 loss, stranding the tying run at third base. On Tuesday, the second baseman homered on the second pitch he saw from Berríos in the second inning. It was Massey’s first homer.
“There’s probably going to be a lot more nights that I leave the tying run on third base than what I did tonight,” Massey said. “You just try to compete, try to battle and stay with your process.”
Toronto’s Bo Bichette hit a two-out RBI single in the sixth but Witt made it 3-1 with an RBI double off Erik Swanson in the eighth. Génesis Cabrera replaced Swanson and gave up an RBI double to Vinnie Pasquantino.
Salvador Perez started at first base for Kansas City one night after being scratched from a start behind the plate because of a sore back. Perez had a pinch hit single in the ninth inning of Monday’s 6-5 loss and was replaced by a pinch runner.
With a leadoff single in the second inning Tuesday, Perez extended his career-best streak of reaching base safely to 20 games.
Toronto’s Davis Schneider hit a one-out single in the second but Royals right fielder Hunter Renfroe threw Schneider out at second base as he tried to extend his hit. Renfroe leads the major leagues with 67 outfield assists since 2017.
George Springer started in center field for the Blue Jays. He didn’t make a single start in center in 2023.
ROSTER MOVES
Royals: Kansas City recalled RHP Colin Selby from Triple-A Omaha and optioned RHP Jonathan Bowlan to Triple-A.
Blue Jays: Toronto put RHP Yariel Rodríguez (back) on the 15-day IL and recalled RHP Zach Pop from Triple-A Buffalo. Rodríguez started Monday, allowing three runs and six hits in 3 2/3 innings. … RHP Alek Manoah (shoulder) allowed one run and two hits in six innings in a rehab start at Triple-A. Manoah struck out 12 and walked two.
UP NEXT
Blue Jays RHP Chris Bassitt (2-4, 5.64) is expected to start Wednesday’s series finale. Kansas City’s scheduled starter is RHP Seth Lugo (4-1, 1.66).
How can I watch Kansas City Royals vs. Toronto Blue Jays?
- TV Channel: Royals at Blue Jays 2022 MLB Baseball, is broadcasted on MLB.tv.
- Online streaming: Sign up for Fubo.
Scoring Summary
 |
9th Inning | Kirk popped out to second. |
 |
9th Inning | Schneider struck out looking. |
 |
9th Inning | Turner popped out to second. |
 |
9th Inning | McArthur relieved Schreiber |
 |
9th Inning | Hampson in left field. |
 |
9th Inning | Renfroe popped out to third. |
Statistics
 KC KC |
 TOR TOR |
|
|---|---|---|
| 1 | Games Played | 1 |
| 1 | Team Games Played | 1 |
| 1 | Hit By Pitch | 0 |
| 12 | Ground Balls | 7 |
| 4 | Strikeouts | 11 |
| 4 | Runs Batted In | 1 |
| 0 | Sacrifice Hit | 0 |
| 8 | Hits | 4 |
| 1 | Stolen Bases | 0 |
| 2 | Walks | 3 |
| 0 | Catcher Interference | 0 |
| 4 | Runs | 1 |
| 2 | Ground Into Double Play | 0 |
| 0 | Sacrifice Flies | 0 |
| 32 | At Bats | 30 |
| 1 | Home Runs | 0 |
| 0 | Grand Slam Home Runs | 0 |
| 8 | Runners Left On Base | 7 |
| 0 | Triples | 0 |
| 1 | Game Winning RBIs | 0 |
| 1 | Intentional Walks | 0 |
| 2 | Doubles | 0 |
| 16 | Fly Balls | 12 |
| 1 | Caught Stealing | 0 |
| 120 | Pitches | 138 |
| 0 | Games Started | 0 |
| 0 | Pinch At Bats | 0 |
| 0 | Pinch Hits | 0 |
| 0.0 | Player Rating | 0.0 |
| 1 | Is Qualified | 1 |
| 1 | Is Qualified In Steals | 0 |
| 13 | Total Bases | 4 |
| 35 | Plate Appearances | 33 |
| 162.0 | Projected Home Runs | 0.0 |
| 3 | Extra Base Hits | 0 |
| 3.3 | Runs Created | 0.3 |
| .250 | Batting Average | .133 |
| .000 | Pinch Hit Average | .000 |
| .406 | Slugging Percentage | .133 |
| .219 | Secondary Average | .100 |
| .314 | On Base Percentage | .212 |
| .721 | OBP Pct + SLG Pct | .345 |
| 0.8 | Ground To Fly Ball Ratio | 0.6 |
| 3.3 | Runs Created Per 27 Outs | 0.3 |
| 32.0 | Batter Rating | 8.0 |
| 32.0 | At Bats Per Home Run | 0.0 |
| 0.50 | Stolen Base Percentage | 0.00 |
| 3.43 | Pitches Per Plate Appearance | 4.18 |
| .156 | Isolated Power | .000 |
| 0.50 | Walk To Strikeout Ratio | 0.27 |
| .057 | Walks Per Plate Appearance | .091 |
| -.031 | Secondary Average Minus Batting Average | -.033 |
| 8.0 | Runs Produced | 2.0 |
| 1.0 | Runs Ratio | 1.0 |
| 0.5 | Patience Ratio | 0.2 |
| 0.3 | Balls In Play Average | 0.2 |
| 81.8 | MLB Rating | 60.5 |
| 0.0 | Offensive Wins Above Replacement | 0.0 |
| 0.0 | Wins Above Replacement | 0.0 |
Game Information

Location: Toronto, Ontario
Attendance: 27,189 | Capacity:
2025 American League Central Standings
| TEAM | W | L | PCT | GB | STRK |
|---|---|---|---|---|---|
 Detroit Detroit |
17 | 10 | .630 | - | W3 |
 Cleveland Cleveland |
15 | 11 | .577 | 1.5 | L1 |
 Kansas City Kansas City |
14 | 14 | .500 | 3.5 | W6 |
 Minnesota Minnesota |
11 | 16 | .407 | 6 | W2 |
 Chicago Chicago |
7 | 20 | .259 | 10 | W1 |
2025 American League East Standings
| TEAM | W | L | PCT | GB | STRK |
|---|---|---|---|---|---|
 New York New York |
15 | 11 | .577 | - | L1 |
 Boston Boston |
15 | 14 | .517 | 1.5 | W1 |
 Toronto Toronto |
13 | 13 | .500 | 2 | W1 |
 Tampa Bay Tampa Bay |
13 | 14 | .481 | 2.5 | W4 |
 Baltimore Baltimore |
10 | 16 | .385 | 5 | L2 |