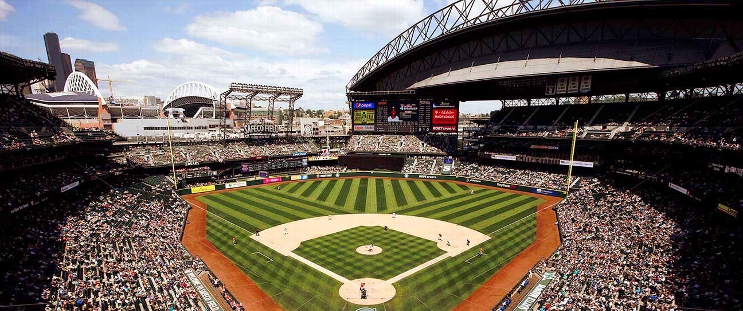
Boston Red Sox at Seattle Mariners
· Major League Baseball
6 - 4

Tyler O'Neill homers for record-setting 5th straight opening day as Red Sox top Mariners 6-4
“Baseball is a funny game,” O'Neill said. “It brings everything home like that.”
O'Neill homered in his fifth straight opening day game to set a major league record and helped the Boston Red Sox beat the Seattle Mariners 6-4 on Thursday night.
Rafael Devers homered and doubled off Seattle ace Luis Castillo, but it was Cody Bolton in the eighth inning that gave the Red Sox a 6-4 lead and made history.
O’Neill homered the previous four opening days with St. Louis, tying him with Todd Hundley (1994-97), Gary Carter (1977-80) and Yogi Berra (1955-58). He was a top prospect in the Mariners organization before being traded to St. Louis in 2017.
And it came in front of a large contingent of family and friends from British Columbia who made the trip down to see O'Neill's first game in a Red Sox uniform.
“You always want to kick the season off with a bang,” O'Neill said. “Fortunately, I've been able to do it a couple times in row now. Just having a lot of fun out there.”
The homers and some solid pitching helped Boston manager Alex Cora enjoy his first opening day win as a manager.
Devers hit an opposite-field two-run homer on an elevated fastball from Castillo in the third inning and his one-out double in the fifth helped lead to another run for Boston. Connor Wong added a two-out RBI single in the sixth on a pitch well off the plate.
“He was able to drive the ball to left-center, something that he wasn't able to do last year," Cora said of Devers. “That homer was impressive.”
Boston starter Brayan Bello (1-0) pitched five innings and limited the damage to Mitch Haniger’s two-run homer after he spent last season with San Francisco. Kenley Jansen pitched the ninth for the save after recording 29 last season for Boston.
Dylan Moore's pinch-hit, two run homer in the seventh inning pulled Seattle within 5-4, but that’s as close as Seattle would get. Two of Seattle’s big offseason additions, Jorge Polanco and Mitch Garver, both experienced some of the frustration that comes with playing at home early in the season. Each hit deep fly balls that likely would have been homers in their former parks, but instead became outs.
“They got some hits with two outs, RBI hits, and those are huge. They're difference makers,” Seattle manager Scott Servais said. “Not the way we wanted to start. We have a lot of games to go. We have a good team.”
Castillo (0-1) labored through five innings as his control got away from him at times, missing with a number of borderline pitches. Castillo, who needed 91 pitches to get through the fifth, gave up four runs and six hits.
TRAINER’S ROOM
Red Sox: RHP Liam Hendriks was placed on the 60-day IL as he continues recovery from Tommy John surgery. ... LHP Chris Murphy was also played on the 60-day IL with a UCL sprain. ... RHP Bryan Mata (hamstring) was placed on the 15-day IL. ... IF Vaughn Grissom (hamstring) and OF Rob Refsnyder (toe) were placed on the 10-day IL.
Mariners: IF/OF Sam Haggerty (undisclosed medical procedure) was placed on the 10-day injured list to begin the season. ... RHPs Matt Brash (elbow strain), Bryan Woo (elbow inflammation), Gregory Santos (lat strain) and Eduardo Bazardo (rotator cuff strain) were placed on the 15-day IL. ... Veteran IF Brian Anderson was released, but agreed to a minor-league contract and was assigned to Triple-A Tacoma.
UP NEXT
A pair of right-handers will face off as Nick Pivetta starts for Boston while George Kirby takes the hill for Seattle.
How can I watch Boston Red Sox vs. Seattle Mariners?
- TV Channel: Red Sox at Mariners 2022 MLB Baseball, is broadcasted on NESN.
- Online streaming: Sign up for Fubo.
Scoring Summary
 |
9th Inning | Raley struck out swinging. |
 |
9th Inning | Raley hit for Urías |
 |
9th Inning | France lined out to right. |
 |
9th Inning | Moore struck out swinging. |
 |
9th Inning | Haniger walked. |
 |
9th Inning | Jansen relieved Martin |
Statistics
 BOS BOS |
 SEA SEA |
|
|---|---|---|
| 1 | Games Played | 1 |
| 1 | Team Games Played | 1 |
| 0 | Hit By Pitch | 1 |
| 12 | Ground Balls | 11 |
| 7 | Strikeouts | 9 |
| 6 | Runs Batted In | 4 |
| 0 | Sacrifice Hit | 0 |
| 11 | Hits | 8 |
| 3 | Stolen Bases | 0 |
| 2 | Walks | 1 |
| 0 | Catcher Interference | 0 |
| 6 | Runs | 4 |
| 0 | Ground Into Double Play | 1 |
| 0 | Sacrifice Flies | 0 |
| 38 | At Bats | 34 |
| 2 | Home Runs | 2 |
| 0 | Grand Slam Home Runs | 0 |
| 18 | Runners Left On Base | 13 |
| 1 | Triples | 0 |
| 1 | Game Winning RBIs | 0 |
| 0 | Intentional Walks | 0 |
| 2 | Doubles | 2 |
| 19 | Fly Balls | 14 |
| 1 | Caught Stealing | 0 |
| 154 | Pitches | 149 |
| 0 | Games Started | 0 |
| 1 | Pinch At Bats | 3 |
| 0 | Pinch Hits | 1 |
| 0.0 | Player Rating | 0.0 |
| 1 | Is Qualified | 1 |
| 1 | Is Qualified In Steals | 0 |
| 21 | Total Bases | 16 |
| 40 | Plate Appearances | 36 |
| 324.0 | Projected Home Runs | 324.0 |
| 5 | Extra Base Hits | 4 |
| 7.0 | Runs Created | 4.2 |
| .289 | Batting Average | .235 |
| .000 | Pinch Hit Average | .333 |
| .553 | Slugging Percentage | .471 |
| .368 | Secondary Average | .265 |
| .325 | On Base Percentage | .278 |
| .878 | OBP Pct + SLG Pct | .748 |
| 0.6 | Ground To Fly Ball Ratio | 0.8 |
| 6.7 | Runs Created Per 27 Outs | 4.2 |
| 50.5 | Batter Rating | 34.0 |
| 19.0 | At Bats Per Home Run | 17.0 |
| 0.75 | Stolen Base Percentage | 0.00 |
| 3.85 | Pitches Per Plate Appearance | 4.14 |
| .263 | Isolated Power | .235 |
| 0.29 | Walk To Strikeout Ratio | 0.11 |
| .050 | Walks Per Plate Appearance | .028 |
| .079 | Secondary Average Minus Batting Average | .029 |
| 12.0 | Runs Produced | 8.0 |
| 1.0 | Runs Ratio | 1.0 |
| 0.6 | Patience Ratio | 0.5 |
| 0.3 | Balls In Play Average | 0.3 |
| 95.5 | MLB Rating | 82.8 |
| 0.0 | Offensive Wins Above Replacement | 0.0 |
| 0.0 | Wins Above Replacement | 0.0 |
Game Information

Location: Seattle, Washington
Attendance: 45,337 | Capacity:
2025 American League East Standings
| TEAM | W | L | PCT | GB | STRK |
|---|---|---|---|---|---|
 New York New York |
12 | 7 | .632 | - | W4 |
 Toronto Toronto |
11 | 8 | .579 | 1 | W2 |
 Boston Boston |
10 | 10 | .500 | 2.5 | W2 |
 Baltimore Baltimore |
8 | 10 | .444 | 3.5 | W2 |
 Tampa Bay Tampa Bay |
8 | 11 | .421 | 4 | L3 |
2025 American League West Standings
| TEAM | W | L | PCT | GB | STRK |
|---|---|---|---|---|---|
 Texas Texas |
12 | 7 | .632 | - | W3 |
 Seattle Seattle |
10 | 9 | .526 | 2 | W2 |
 Los Angeles Los Angeles |
9 | 9 | .500 | 2.5 | L4 |
 Athletics Athletics |
9 | 10 | .474 | 3 | W3 |
 Houston Houston |
8 | 10 | .444 | 3.5 | L1 |