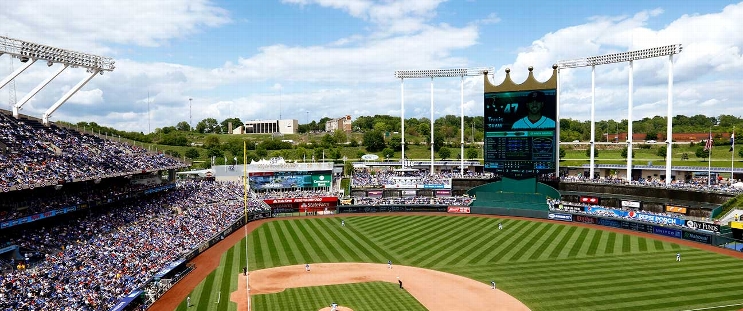
Boston Red Sox at Kansas City Royals
· Major League Baseball
9 - 5

Triston Casas' homer, Alex Verdugo’s 3 hits lead the Red Sox to a 9-5 win over the Royals
Six Boston batters drove in a run and all but one Red Sox starter had a hit. Boston snapped a five-game skid with the win after allowing four runs for the 12th time in 13 games.
Tanner Houck (4-8) worked five innings and allowed four runs and seven hits while walking one and striking out five.
“It felt good, it was good to be around that 100 pitch mark. It was something that I haven’t reached in a while,” Houck said. “To reach that milestone in terms of the progression, it felt good. It was good to know that I don’t have a pitch count, i can just go out there and compete at the highest level I can and put the team position to win.”
Royals starter Alec March (0-8) was knocked out of the game early after allowing six runs on seven hits. He walked two and struck out one in 2 ⅔ innings.
“I think there was a controlled focus in here this morning,” Verdugo said. “This one feels good because their record might not show, but that's a good team with a lot of talent over there.”
Kansas City has lost 11 of its last 13 games. The Royals haven't won a series since Aug. 3 and need a victory in the series finale on Sunday to end the skid.
The Red Sox capped a three-run first inning with Casas' two-run homer to right field. Boston had four extra-base hits in the inning. Cases went 2 for 4 with two RBI and two runs scored.
“Offensively, I think there is another run in this team in September,” Boston manager Alex Cora said. “Everyone gets hot at the same time, but at least for today that was a good one.”
MJ Melendez homered for Kansas City and Maikel Garcia, MJ Melendez, and Nelson Velazquez drove in runs.
“We had a big chance in the sixth, we just didn’t bust it open or make up all the ground, but overall we competed until the end, putting some good at-bats together in the ninth,” Royals manager Matt Quatraro said.
YOST TO THE HALL OF FAME
Prior to the game, former manager Ned Yost was inducted into the Royals Hall of Fame. He led Kansas City to a World Series championship in 2015 and has the highest postseason winning percentage in MLB history.
UP NEXT
Chris Sale (5-3, 4.75 ERA) will start for the Red Sox in the series finale on Sunday. The Royals have not announced a starter.
How can I watch Boston Red Sox vs. Kansas City Royals?
- TV Channel: Red Sox at Royals 2022 MLB Baseball, is broadcasted on MLB.tv.
- Online streaming: Sign up for Fubo.
Matchup Prediction
Scoring Summary
 |
9th Inning | Waters lined out to right. |
 |
9th Inning | Massey doubled to right. |
 |
9th Inning | Fermin struck out swinging. |
 |
9th Inning | Perez struck out swinging. |
 |
9th Inning | Melendez homered to right (404 feet). |
 |
9th Inning | McGuire bunt grounded out to third. |
Statistics
 BOS BOS |
 KC KC |
|
|---|---|---|
| 1 | Games Played | 1 |
| 1 | Team Games Played | 1 |
| 0 | Hit By Pitch | 3 |
| 11 | Ground Balls | 10 |
| 7 | Strikeouts | 10 |
| 9 | Runs Batted In | 5 |
| 0 | Sacrifice Hit | 0 |
| 13 | Hits | 11 |
| 0 | Stolen Bases | 0 |
| 4 | Walks | 2 |
| 0 | Catcher Interference | 0 |
| 9 | Runs | 5 |
| 1 | Ground Into Double Play | 0 |
| 0 | Sacrifice Flies | 0 |
| 40 | At Bats | 38 |
| 1 | Home Runs | 1 |
| 0 | Grand Slam Home Runs | 0 |
| 18 | Runners Left On Base | 22 |
| 1 | Triples | 0 |
| 1 | Game Winning RBIs | 0 |
| 0 | Intentional Walks | 0 |
| 5 | Doubles | 5 |
| 22 | Fly Balls | 18 |
| 0 | Caught Stealing | 0 |
| 152 | Pitches | 151 |
| 0 | Games Started | 0 |
| 0 | Pinch At Bats | 0 |
| 0 | Pinch Hits | 0 |
| 0.0 | Player Rating | 0.0 |
| 1 | Is Qualified | 1 |
| 0 | Is Qualified In Steals | 0 |
| 23 | Total Bases | 19 |
| 44 | Plate Appearances | 43 |
| 162.0 | Projected Home Runs | 162.0 |
| 7 | Extra Base Hits | 6 |
| 8.3 | Runs Created | 7.2 |
| .325 | Batting Average | .289 |
| .000 | Pinch Hit Average | .000 |
| .575 | Slugging Percentage | .500 |
| .350 | Secondary Average | .263 |
| .386 | On Base Percentage | .372 |
| .961 | OBP Pct + SLG Pct | .872 |
| 0.5 | Ground To Fly Ball Ratio | 0.6 |
| 8.0 | Runs Created Per 27 Outs | 7.2 |
| 64.5 | Batter Rating | 44.0 |
| 40.0 | At Bats Per Home Run | 38.0 |
| 0.00 | Stolen Base Percentage | 0.00 |
| 3.45 | Pitches Per Plate Appearance | 3.51 |
| .250 | Isolated Power | .211 |
| 0.57 | Walk To Strikeout Ratio | 0.20 |
| .091 | Walks Per Plate Appearance | .047 |
| .025 | Secondary Average Minus Batting Average | -.026 |
| 18.0 | Runs Produced | 10.0 |
| 1.0 | Runs Ratio | 1.0 |
| 0.6 | Patience Ratio | 0.6 |
| 0.4 | Balls In Play Average | 0.4 |
| 105.5 | MLB Rating | 91.0 |
| 0.0 | Offensive Wins Above Replacement | 0.0 |
| 0.0 | Wins Above Replacement | 0.0 |
Game Information

Location: Kansas City, Missouri
Attendance: 20,527 | Capacity:
2024 American League East Standings
| TEAM | W | L | PCT | GB | STRK |
|---|---|---|---|---|---|
 New York New York |
94 | 68 | .580 | - | W1 |
 Baltimore Baltimore |
91 | 71 | .562 | 3 | W3 |
 Boston Boston |
81 | 81 | .500 | 13 | W1 |
 Tampa Bay Tampa Bay |
80 | 82 | .494 | 14 | L1 |
 Toronto Toronto |
74 | 88 | .457 | 20 | L3 |
2024 American League Central Standings
| TEAM | W | L | PCT | GB | STRK |
|---|---|---|---|---|---|
 Cleveland Cleveland |
92 | 69 | .571 | - | L2 |
 Kansas City Kansas City |
86 | 76 | .531 | 6.5 | W1 |
 Detroit Detroit |
86 | 76 | .531 | 6.5 | L2 |
 Minnesota Minnesota |
82 | 80 | .506 | 10.5 | L4 |
 Chicago Chicago |
41 | 121 | .253 | 51.5 | W2 |