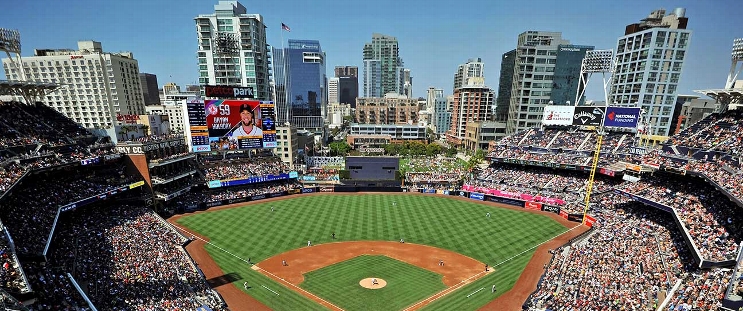
Tampa Bay Rays at San Diego Padres
· Major League Baseball
0 - 2

Snell strikes out 12 in 6 innings as the Padres blank the Rays 2-0
“A little bit of a hybrid curve. He threw some sliders today, another good day for his changeup — it was a little bit of a different mix,” Padres manager Bob Melvin said. “The fastball command really sets everything else up.”
Juan Soto hit a sacrifice fly in the fifth and Manny Machado drove in a run with an infield single after the Padres opened the inning with three consecutive bunts.
Snell (3-6) also fanned 12 in his previous start, a no-decision against Colorado. He mixed his pitches masterfully versus the major league-leading Rays, getting four strikeouts on fastballs, four on sliders, three on curveballs and one on a changeup.
“That was a really strong outing. He had everything going,” Rays manager Kevin Cash said. “From the first inning, just his stuff and the strike-throwing, you kind of had that feeling like, uh-oh. He backed it up for his six innings of work.”
Snell came up in the Rays organization and pitched for them for five years, winning the AL Cy Young Award in 2018 before being traded to the Padres prior to the 2021 season.
“A lot of emotions, for sure,” Snell said. “A lot of those guys were with me the day I walked in the door as a professional. ... Pitching in front of them was everything for me.”
The left-hander gave up just two hits, walked three and worked out of jams with multiple runners on base in the fourth and fifth. He struck out six of his first eight batters.
“There are times when the pitcher is pitching very well and you can’t get a hit off him,” Rays leadoff batter Yandy Díaz said through an interpreter. “(His fastball) was very hard to hit today.”
Steven Wilson and Nick Martinez each pitched a perfect inning before Josh Hader worked the ninth for his 17th save. Hader gave up an infield single to Taylor Walls with two outs, then whiffed Manuel Margot to finish the three-hitter.
Tampa Bay struck out 17 times.
San Diego played small ball against starter Zach Eflin (8-3) in the fifth. Ha-Seong Kim and Trent Grisham opened the inning with successive bunt singles. Fernando Tatis Jr. laid down a sacrifice bunt to advance both runners. Soto followed with a sacrifice fly to center field, and Machado hit an infield single that made it 2-0.
“I committed to get on base that inning as a leadoff hitter. I noticed the third baseman was playing a little deep so I thought it was the perfect chance to put the bunt down,” Kim said through an interpreter. “Blake was pitching really good so if we scored a run first we had a good chance to win the ballgame.”
It was the second consecutive loss for Eflin, who gave up three hits and struck out five in six innings. Last time out in Oakland, he permitted four runs in 4 2/3 innings.
“Eflin was awesome. I felt bad for that one inning,” Cash said. “Let me know the last time the Padres attempted four bunts in one inning, but it worked.”
With the loss, Tampa Bay dropped to 15-8 in interleague play. It was the fourth time this year the Rays were shut out, and first since May 29 at the Chicago White Sox.
ATTENDANCE RECORDS
The crowd of 43,180 was a Petco Park record for the Padres. It was their 27th sellout of the season, breaking their previous mark of 26 set last year. Entering the day, the Padres were averaging 40,467 fans per home game — second in the majors behind the Los Angles Dodgers (47,800).
UP NEXT
Padres RHP Joe Musgrove (4-2, 4.37 ERA) starts Sunday in the finale of the three-game series. RHP Yonny Chirinos (3-1, 3.25) goes for Tampa Bay.
How can I watch Tampa Bay Rays vs. San Diego Padres?
- TV Channel: Rays at Padres 2022 MLB Baseball, is broadcasted on FOX.
- Online streaming: Sign up for Fubo.
Matchup Prediction
Scoring Summary
 |
9th Inning | Margot struck out swinging. |
 |
9th Inning | Walls reached on infield single to shortstop. |
 |
9th Inning | Paredes lined out to third. |
 |
9th Inning | Arozarena struck out swinging. |
 |
9th Inning | Hader relieved Martinez |
 |
8th Inning | Cronenworth grounded out to shortstop. |
Statistics
 TB TB |
 SD SD |
|
|---|---|---|
| 1 | Games Played | 1 |
| 1 | Team Games Played | 1 |
| 1 | Hit By Pitch | 0 |
| 8 | Ground Balls | 11 |
| 17 | Strikeouts | 6 |
| 0 | Runs Batted In | 2 |
| 0 | Sacrifice Hit | 1 |
| 3 | Hits | 4 |
| 1 | Stolen Bases | 1 |
| 3 | Walks | 3 |
| 0 | Catcher Interference | 0 |
| 0 | Runs | 2 |
| 0 | Ground Into Double Play | 0 |
| 0 | Sacrifice Flies | 1 |
| 30 | At Bats | 27 |
| 0 | Home Runs | 0 |
| 0 | Grand Slam Home Runs | 0 |
| 11 | Runners Left On Base | 11 |
| 0 | Triples | 0 |
| 0 | Game Winning RBIs | 1 |
| 0 | Intentional Walks | 0 |
| 1 | Doubles | 1 |
| 5 | Fly Balls | 12 |
| 0 | Caught Stealing | 0 |
| 141 | Pitches | 115 |
| 0 | Games Started | 0 |
| 0 | Pinch At Bats | 0 |
| 0 | Pinch Hits | 0 |
| 0.0 | Player Rating | 0.0 |
| 1 | Is Qualified | 1 |
| 1 | Is Qualified In Steals | 1 |
| 4 | Total Bases | 5 |
| 34 | Plate Appearances | 32 |
| 0.0 | Projected Home Runs | 0.0 |
| 1 | Extra Base Hits | 1 |
| 0.4 | Runs Created | 1.3 |
| .100 | Batting Average | .148 |
| .000 | Pinch Hit Average | .000 |
| .133 | Slugging Percentage | .185 |
| .167 | Secondary Average | .185 |
| .206 | On Base Percentage | .226 |
| .339 | OBP Pct + SLG Pct | .411 |
| 1.6 | Ground To Fly Ball Ratio | 0.9 |
| 0.4 | Runs Created Per 27 Outs | 1.4 |
| 6.0 | Batter Rating | 15.0 |
| 0.0 | At Bats Per Home Run | 0.0 |
| 1.00 | Stolen Base Percentage | 1.00 |
| 4.15 | Pitches Per Plate Appearance | 3.59 |
| .033 | Isolated Power | .037 |
| 0.18 | Walk To Strikeout Ratio | 0.50 |
| .088 | Walks Per Plate Appearance | .094 |
| .067 | Secondary Average Minus Batting Average | .037 |
| 0.0 | Runs Produced | 4.0 |
| 0.0 | Runs Ratio | 1.0 |
| 0.2 | Patience Ratio | 0.3 |
| 0.2 | Balls In Play Average | 0.2 |
| 56.3 | MLB Rating | 66.3 |
| 0.0 | Offensive Wins Above Replacement | 0.0 |
| 0.0 | Wins Above Replacement | 0.0 |
Game Information

Location: San Diego, California
Attendance: 43,180 | Capacity:
2024 American League East Standings
| TEAM | W | L | PCT | GB | STRK |
|---|---|---|---|---|---|
 New York New York |
94 | 68 | .580 | - | W1 |
 Baltimore Baltimore |
91 | 71 | .562 | 3 | W3 |
 Boston Boston |
81 | 81 | .500 | 13 | W1 |
 Tampa Bay Tampa Bay |
80 | 82 | .494 | 14 | L1 |
 Toronto Toronto |
74 | 88 | .457 | 20 | L3 |
2024 National League West Standings
| TEAM | W | L | PCT | GB | STRK |
|---|---|---|---|---|---|
 Los Angeles Los Angeles |
98 | 64 | .605 | - | W5 |
 San Diego San Diego |
93 | 69 | .574 | 5 | L1 |
 Arizona Arizona |
89 | 73 | .549 | 9 | W1 |
 San Francisco San Francisco |
80 | 82 | .494 | 18 | L1 |
 Colorado Colorado |
61 | 101 | .377 | 37 | L3 |